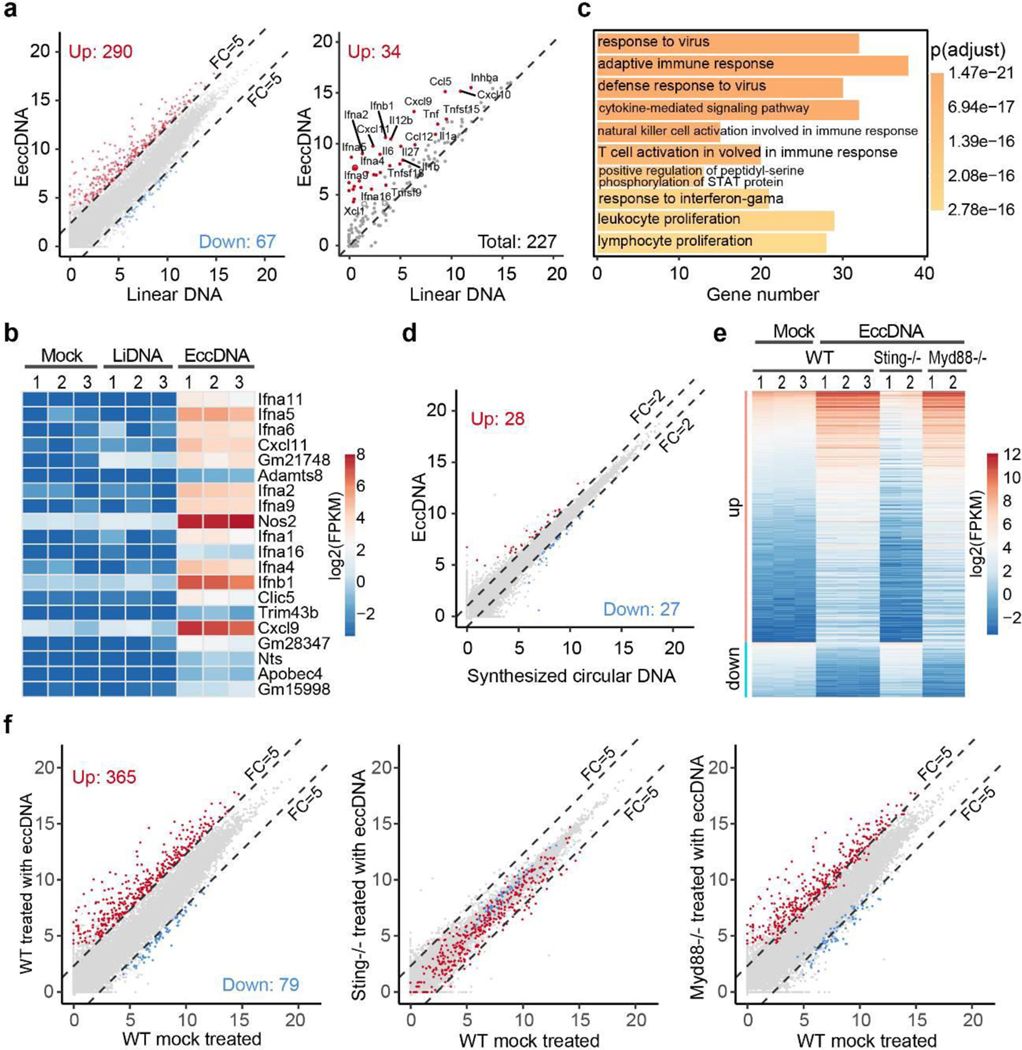
Fig. 5. Sting is required for eccDNA induced gene expression.
a, Scatter plot showing 290 genes (left panel, red dots) that are significantly induced by eccDNA, but not linear DNA, in BMDC. 34 significantly induced cytokine genes are indicated (right panel, red dots). FC (fold change).
b, Heatmap presentation of the top 20 induced genes.
c, GO terms enriched in the genes activated by eccDNA treatment in BMDC. The number of genes in each term and the p-values of the enrichment are indicated.
d, Scatter plot indicates that the transcriptomes of BMDC treated with eccDNAs and synthetic circular DNA are highly similar.
e, Heatmap presentation of the eccDNA responsive genes in control and eccDNA treated BMDC of the indicated genotypes.
f, Scatter plots comparing the transcriptome affected by eccDNA in BMDC from WT, Sting−/−, and Myd88−/− mice. EccDNA responsive genes in WT BMDC are indicated by red dots (up-regulated, n=365) and blue dots (down-regulated, n=79). The x and y-axis are log2-transformed normalized read counts, p-value were generated using DESeq242 and adjusted by IHW43(a, d, and f); FC ≥ 5, adjusted p-value < 0.001 in ( a and f); FC ≥ 2, adjusted p-value < 0.01 in (d).

