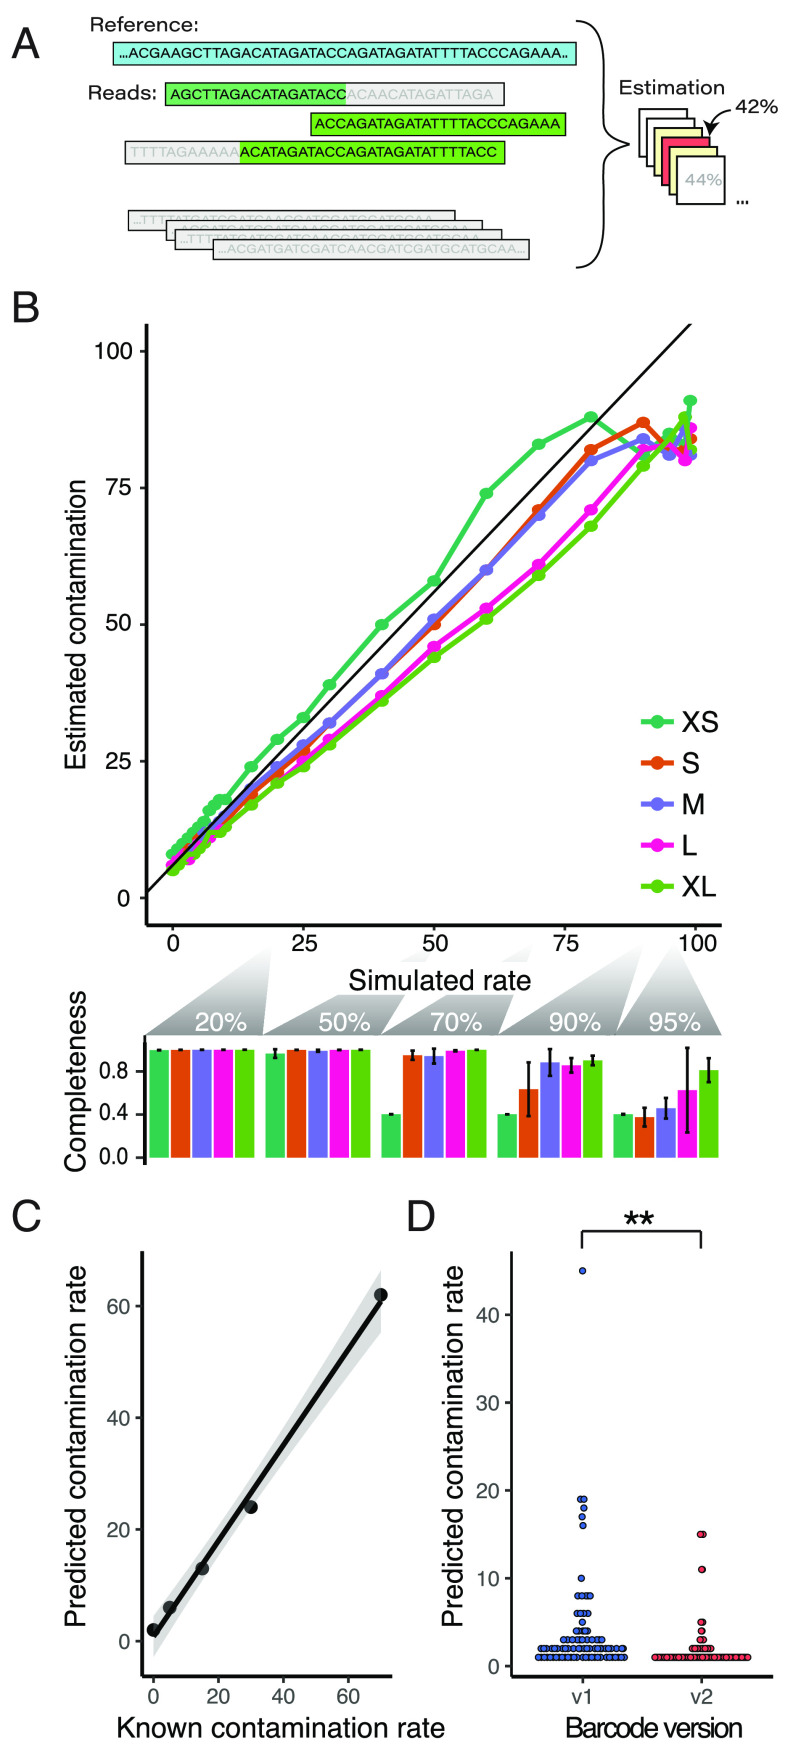
Figure 3.
(A) Contamination rates calculated from the proportion of unaligned bases and the global shared sequence proportions between plasmids, estimated over a range of contamination hypotheses. (B) In silico contamination estimates of assembled Addgene plasmids using simulated reads over a range of plasmid lengths (upper panel; XS = extra small to XL = extra large maps). Our estimates track the programmed rates well (r = 0.97, RSME = 9.1), though at higher contamination levels our assemblies had issues that resulted in poor contamination estimates, which can be seen in the assembly completeness dropoff for small plasmids at >70% contamination and at >90% for larger plasmids (lower panel). (C) Correlation of an in vitro mixing experiment of two known plasmids prior to sequencing and assembly. Contamination estimates were well-correlated to the mixing proportion (r = 0.997, RSME = 4.66), though we failed to assemble the plasmids at the two highest contamination levels (85% and 95% contaminated). (D) Estimated contamination rates significantly dropped with our improved Tn5 barcoding design (p = 0.00119).

