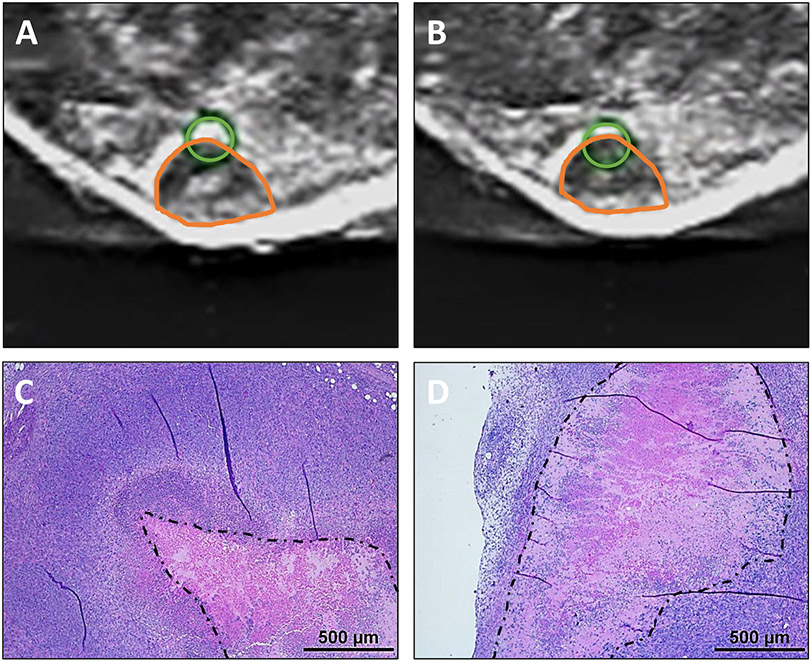
Fig. 4.
Ultrasound images of tumor (a) before and (b) after treatment, exhibiting more hypoechoic central region posthistotripsy. Orange shapes on ultrasound indicate the location of tumors. Green circles indicate the location of bubble cloud determined in water prior to treatment and were utilized for treatment planning. Histology to tumors (c) without and (d) with treatment shows decreased cellular detail after treatment. The dotted black line outlines the necrotic core of the tissue. Scale bar on H&E images = 500 μm.

