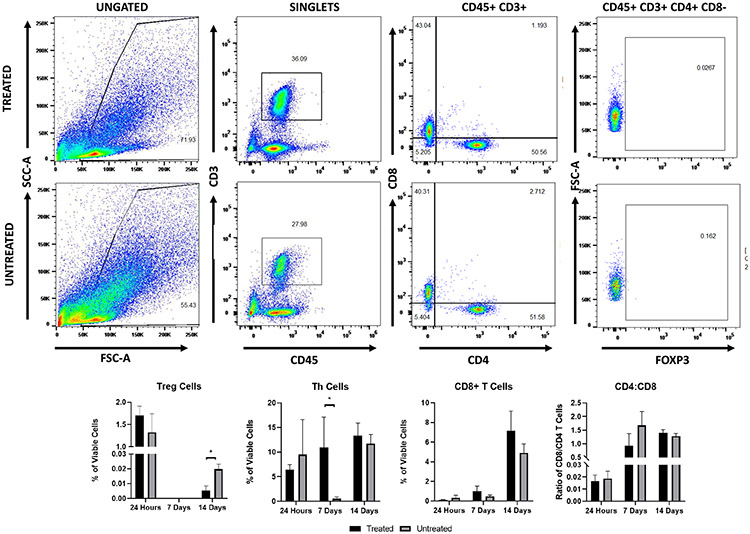
Fig. 8.
Single-cell suspension from treated and untreated tumors were collected at 24 h and seven and 14 days after treatment and were stained as described for flow cytometry to identify adaptive immune cells. The percentage of each adaptive immune cell population analyzed was calculated as part of the total viable cells stained (gated as singlets). The ratio of CD4+/CD8+ T cells was calculated as a simple ratio. Example flow cytometry plots from treated and untreated tumors at 14 days after treatment.

