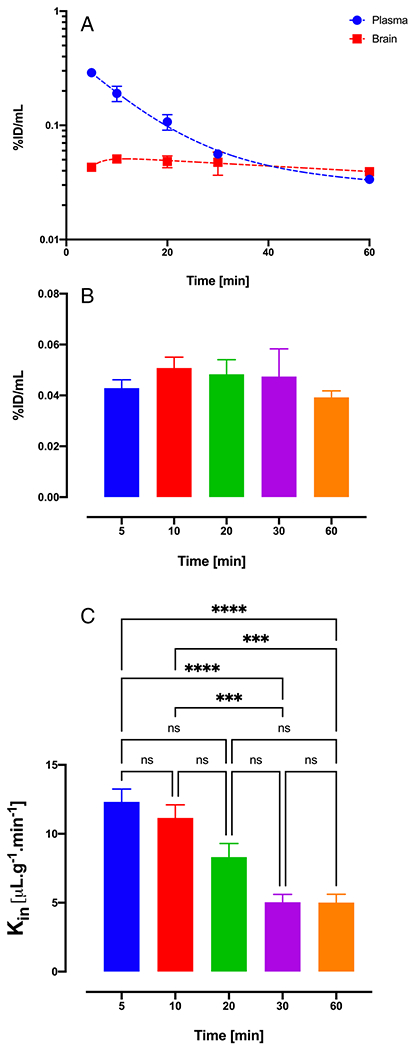
Fig. 4. Brain uptake profile and uptake clearance of 11a using multiple time point analysis.

(A) Plasma and brain pharmacokinetic profile reported as percent injected dose of 11a. (B) Brain concentrations of 11a at different time points until 60 min. (C) Brain uptake clearance of 11a using multiple time points. Data are represented as mean±SD. (n=4 animals for each time point).
