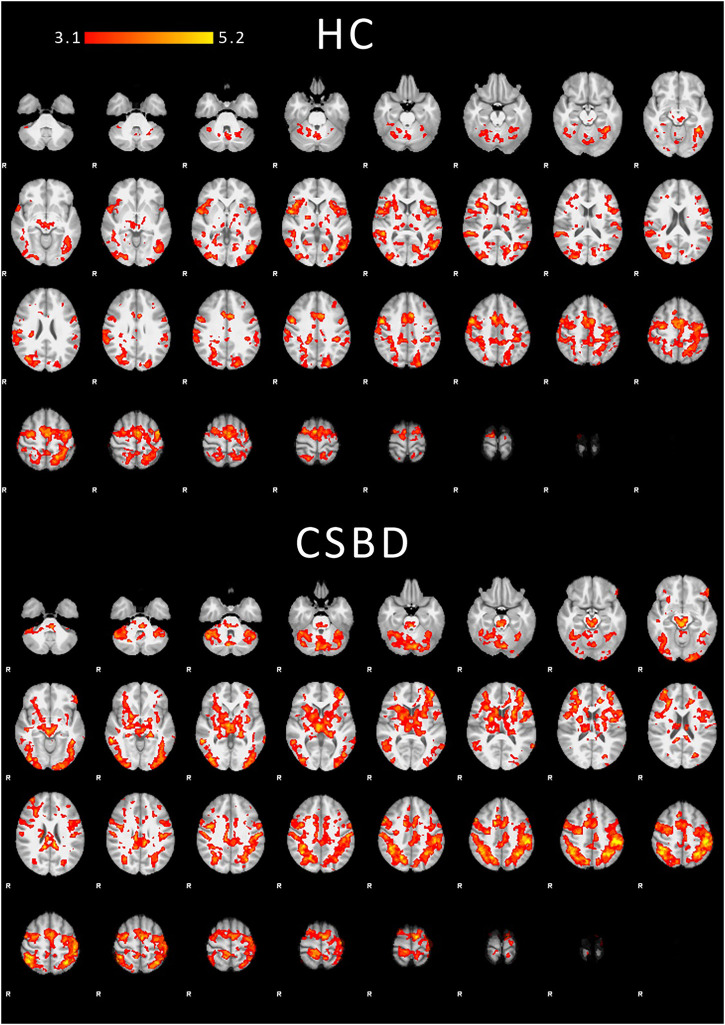
Fig. 3.
Within-group task-related fMRI mean activations. Corrected COPE mean activations (erotic > non-erotic) for contrast 1 (anticipation) are displayed for both healthy controls (HC, top) and CSBD patients (bottom). Z values are indicated by color (heat map). Although there are visual regional differences in activation patterns between HC and CSBD, direct group comparisons were not significant after correction (same applied to the reversed contrast HC > CSBD). Note that whole brain analyses were exploratory. Results for contrast 2 (viewing phase) and uncorrected group comparisons at a threshold of P = 0.01 are shown in the Supplemental Materials (Figure S3–S6). Cluster statistics, MNI coordinates of activation maxima, and regional labels are provided in the Supplemental Materials Table S10 and S12

