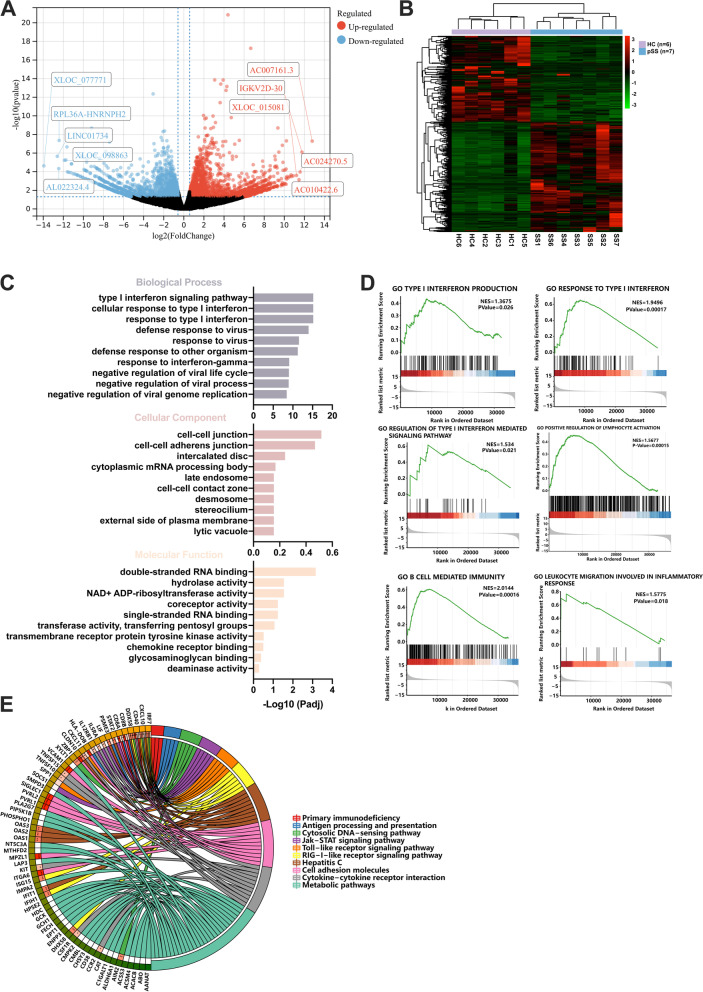
Fig. 2.
RNA-seq analysis for pSS neutrophils (pSS=7, HC=6). A The volcano plot for DE mRNAs of pSS neutrophils (239 upregulated in red and 181 downregulated mRNAs in blue, TOP 5 up- and downregulated genes were annotated). B The hierarchical clustering heatmap for DE mRNAs of the pSS neutrophils. C GO enrichment analysis for DE mRNAs of pSS neutrophils (implemented by the clusterProfiler R package). D GSEA for the potential function of DE mRNAs of pSS neutrophils. E KEGG analysis for the potential pathways of pSS neutrophils’ DE mRNAs. Different colors represented for the different signaling pathways. *P-value < 0.05, **P-value < 0.01, ***P-value <0.001)

