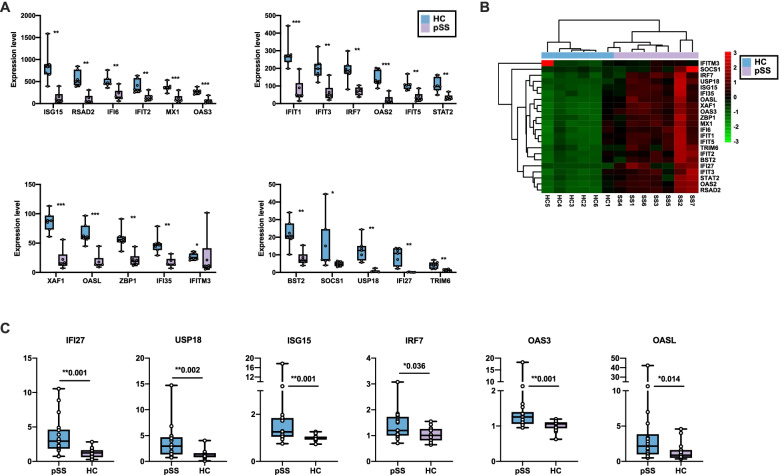
Fig. 3.
The overexpressed type I interferon signaling pathway-related genes in pSS neutrophils. A Comparison the expression level of type I-related genes between neutrophils isolated from pSS patients and healthy controls in RNA sequencing analysis (pSS=7, HC=6). B The hierarchical clustering heatmap for DE Type I-related genes in pSS and healthy neutrophils (pSS=7, HC=6). C RT-qPCR results for type I-related mRNAs in pSS and healthy neutrophils (pSS=18, HC=17). P-value > 0.05 indicated no statistically significant difference (ns), *P-value < 0.05, **P-value < 0.01, ***P-value <0.001

