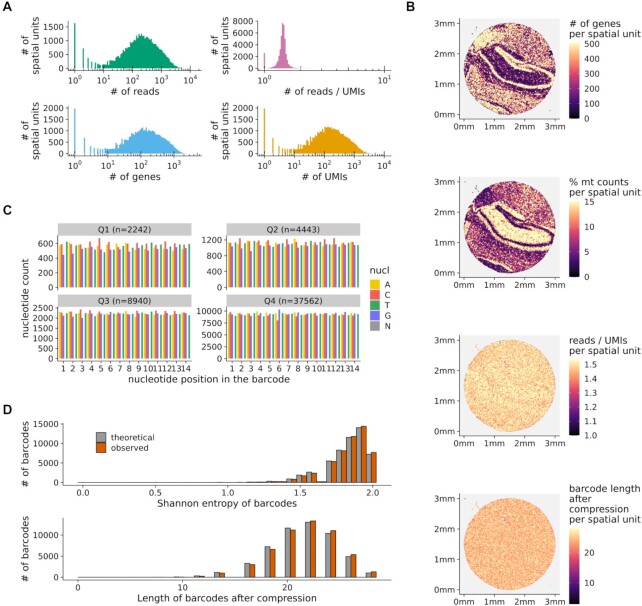
Figure 2:
Spacemake produces uniform quality control reports. (A) Histograms showing the number of genes, reads, UMIs, and reads/UMIs ratios per spatial unit. (B) Quality control metrics plotted in tissue space. Top to bottom: number of genes, percentage of mitochondrial counts, reads/UMIs ratios, and barcode length after compression, all shown per spatial unit. (C) Nucleotide frequencies per barcode position and quantile (segregated by the number of reads). (D) Shannon entropy and string compression length of the sequenced barcodes versus the expected theoretical distributions.

