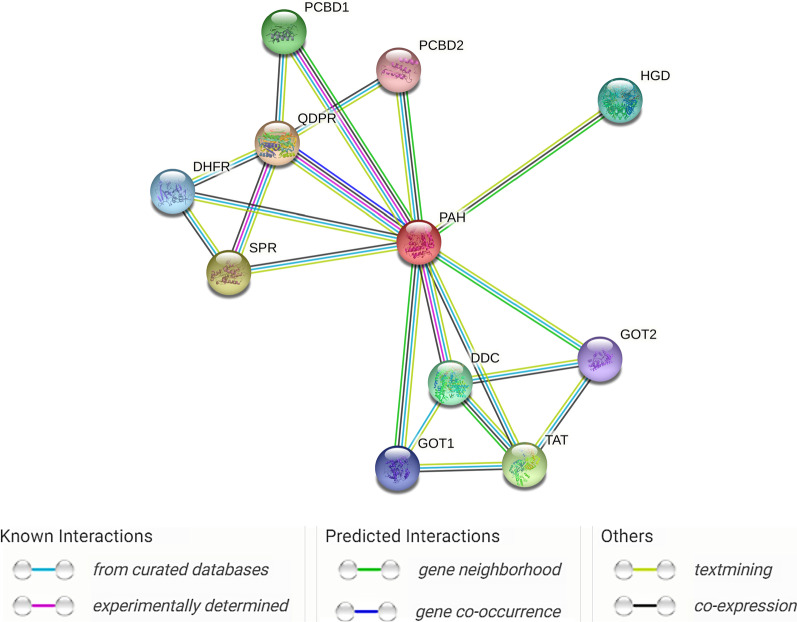
Fig. 3.
Protein network interactions contained the PAH and 10 related genes examined in this review created with STRING (https://string-db.org/), where there are strong interactions between the PAH gene and associated BH4 genes. Each node represents all the proteins (n = 11) produced by a single, protein-coding gene locus. Colored nodes describe proteins and the first shell of interactors. Edges represent protein–protein associations (n = 20) that are meant to be specific and meaningful, i.e., proteins jointly contribute to a shared function; this does not necessarily mean they are physically binding each other

