Fig. 3.
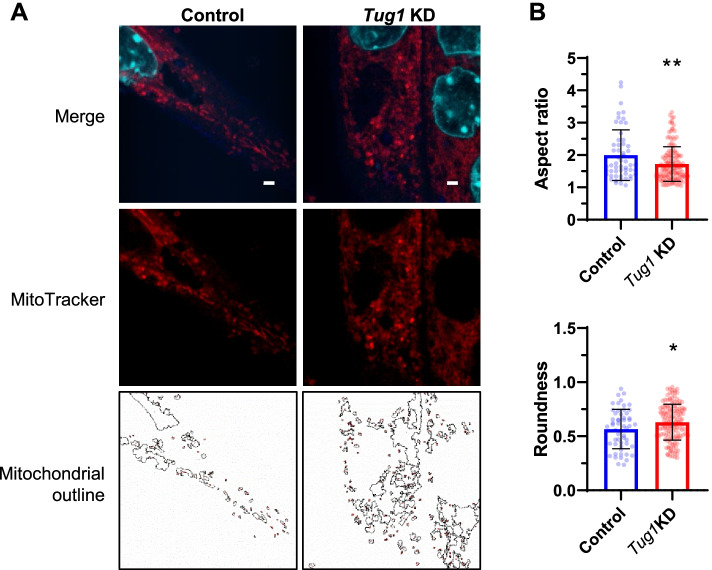
Mitochondrial morphology is more fragmented in Tug1 KD myotubes. C2C12 myocytes were differentiated for 3 days, transfected with Tug1 and control LNAs (25 nM) for 24 h. A Confocal microscopy of mitochondria (red channel; MitoTracker RedCMXros, 50 nM), F-actin (blue channel; phalloidin) and nuclei (cyan; DAPI). Scale bar = 2 μm. B Morphology analyses of mitochondria shown in A. Individual points are the quantification of each outlined region and bars represent the mean (SD) for one replicate analysed by unpaired two-tailed t-test: *p<0.05, **p<0.01. See also Additional file 1: Supplementary Fig. S3; individual data are available at DOI: 10.6084/m9.figshare.20175770 [24]

