Fig. 6.
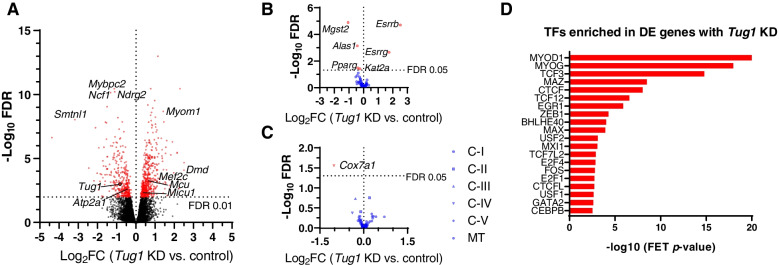
Transcriptomic responses to Tug1 KD in myotubes. C2C12 myocytes were differentiated for 3 days, transfected with Tug1 or control LNAs for 24 h, then harvested on day 4 for RNA-seq. A Volcano plot of 867 differentially expressed genes (FDR<0.01, red points) that were upregulated (positive log2FC) or downregulated (negative log2FC) as a result of Tug1 KD compared to control. Selected genes of interest are labelled (see supplementary tables for full list). B Volcano plot of PGC-1α target genes with Tug1 KD compared to control. C Volcano plot of nuclear-encoded mitochondrial ETC subunits of complexes I to V (C-I – C-V) as well as mtDNA-encoded (MT) subunit expression with Tug1 KD compared to control. D Transcription factors enriched among DE genes due to Tug1 KD. Data are from n=6 libraries per group (triplicate wells from two independent experiments for each condition). See also Additional file 1: Supplementary Fig. S5, as well as Additional file 2: Supplementary tables S1 and S2

