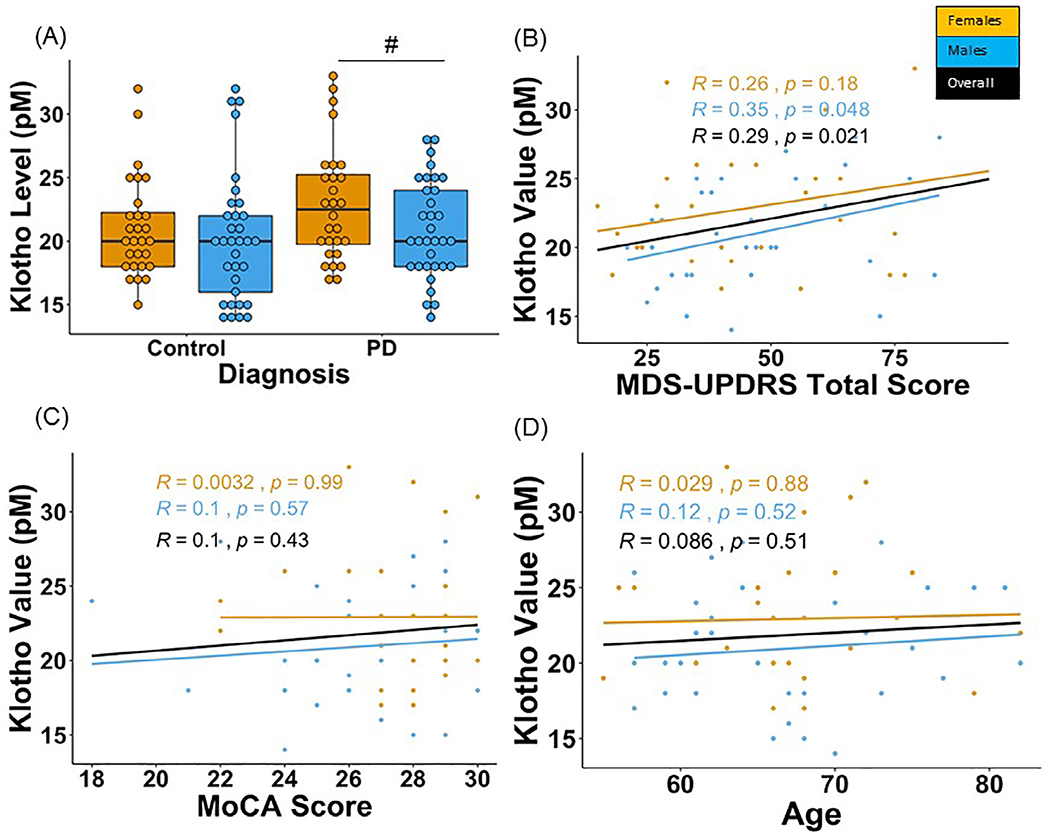
FIG. 1.

Klotho levels in PD patients and healthy controls in the BioFIND cohort. A pilot study was performed with four BioFIND subject plasma samples to confirm assay quality control. Klotho levels were measured in duplicate and compared against the standard range for healthy adults (22–40 pM). Plasma samples used to confirm assay quality fell in the range: 20.7–37.2 pM (mean = 29.7 ± 7.2 pM). The duplicate values for the samples in the pilot had an acceptable coefficient of variation (7%). Therefore, we proceeded to analyze the full cohort of plasma samples. A total of 122 plasma samples from baseline (V1) were secured from the BioFIND11 cohort database; 61 PD samples and 61 age- and sex-matched healthy controls. Samples were selected such that each age decade (50–90 years) was represented and matched between the two groups. Important clinical characteristics of the PD patients analyzed include average age = 66.9 ± 6.8 years, mean = 51.7 ± 20.9 MDS-UPDRS score, the H&Y score ranged from 1–4, and the average MoCA and RBD score was 26.8 ± 2.5, 5.5 ± 3.4, respectively. The healthy control demographics include average age = 66.8 ± 6.9 years, MoCa and RBD scores are 27.8 ± 1.4, 2.1 ± 1.6, respectively. The analysis for Klotho levels was performed blinded. (A) Female PD patients tended to have higher Klotho levels compared to male PD patients. Levels of Klotho were similar in men and women in healthy controls. (B) No correlation was found between Klotho levels and total MDS-UPDRS scores in PD patients. (C) A lack of an association between Klotho and MoCA scores and (D) age was observed. #Denotes tendency for statistical significance (P = 0.05–0.10). Raw data were sorted by patient number and compiled together using R version 1.1.463. Group comparisons between PD and healthy control groups for Klotho levels were performed using a one-way ANOVA. A two-way ANOVA was performed to understand the interaction between disease (PD and control) and biological sex (men and women). Exploratory post-hoc using one-way ANOVAs were performed for PD and control groups separately. Separate univariate ANOVAs were performed on the PD group for comparing Klotho levels in groups stratified based on years since diagnosis and those based on H&Y Scores (P < 0.05). Bonferroni corrections were performed for suitable comparisons to account for family-wise errors. Finally, Pearson product–moment correlation coefficients (r2) were calculated (R program-library ggscatter) for levels of Klotho and clinical scores from the MDS-UPDRS. The statistical significance thresholds were adjusted for multiple comparisons and set at P < 0.01 for all correlations.
