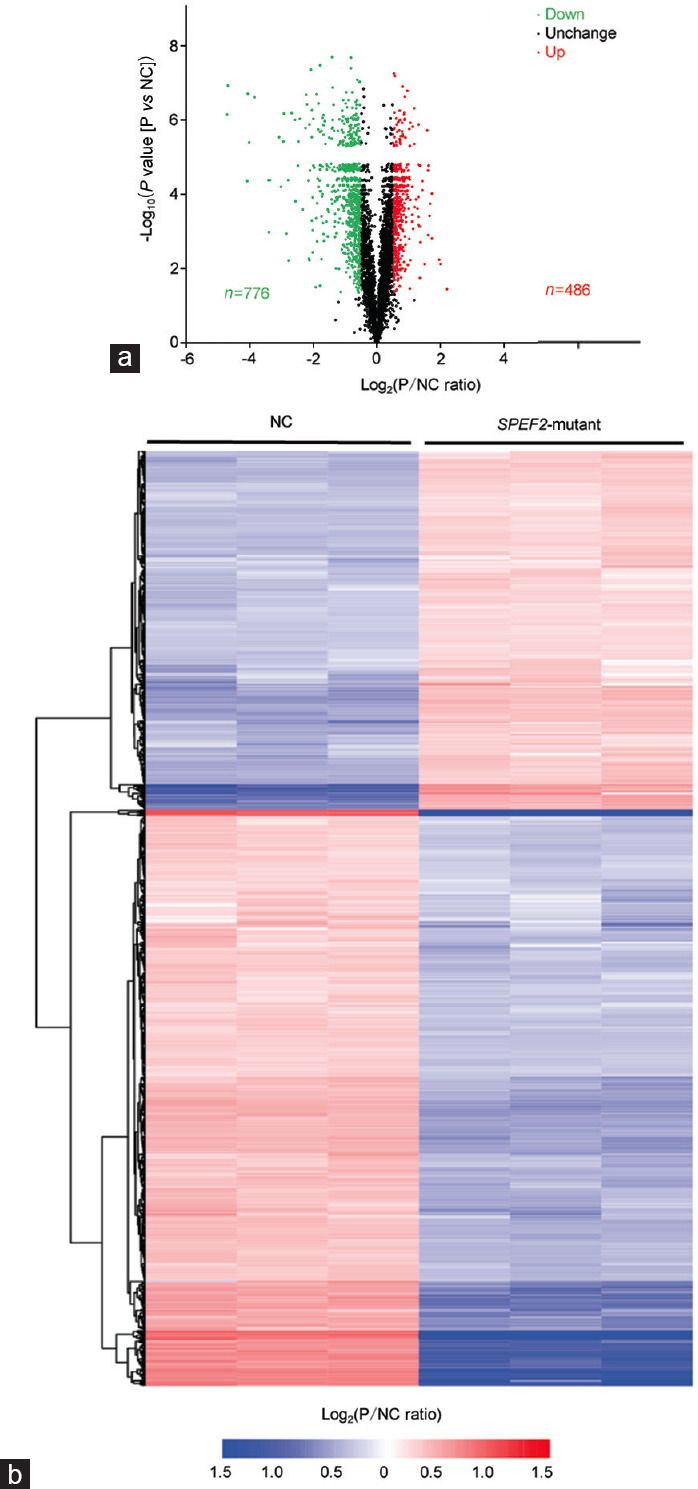
Figure 1.

SPEF2 mutation and changes in sperm flagella proteome. (a) Volcano plot showing proteins with altered expression from the proteomics analysis of SPEF2 mutants and normal controls (NCs). P: SPEF2-mutant samples. A total of 486 upregulated (red) and 776 downregulated (green) proteins were found. Red spot, upregulated protein; green spot, downregulated protein; black spot, unchanged protein. (b) Heat map of differentially expressed sperm proteins. NC and SPEF2-mutation samples were compared to determine the changes in the selected proteins in three repeated experiments; the similar trends observed indicate that the protein quantification is consistent. Blue indicates low expression. Red indicates high expression. SPEF2: sperm flagellar protein 2.
