FIG 2.
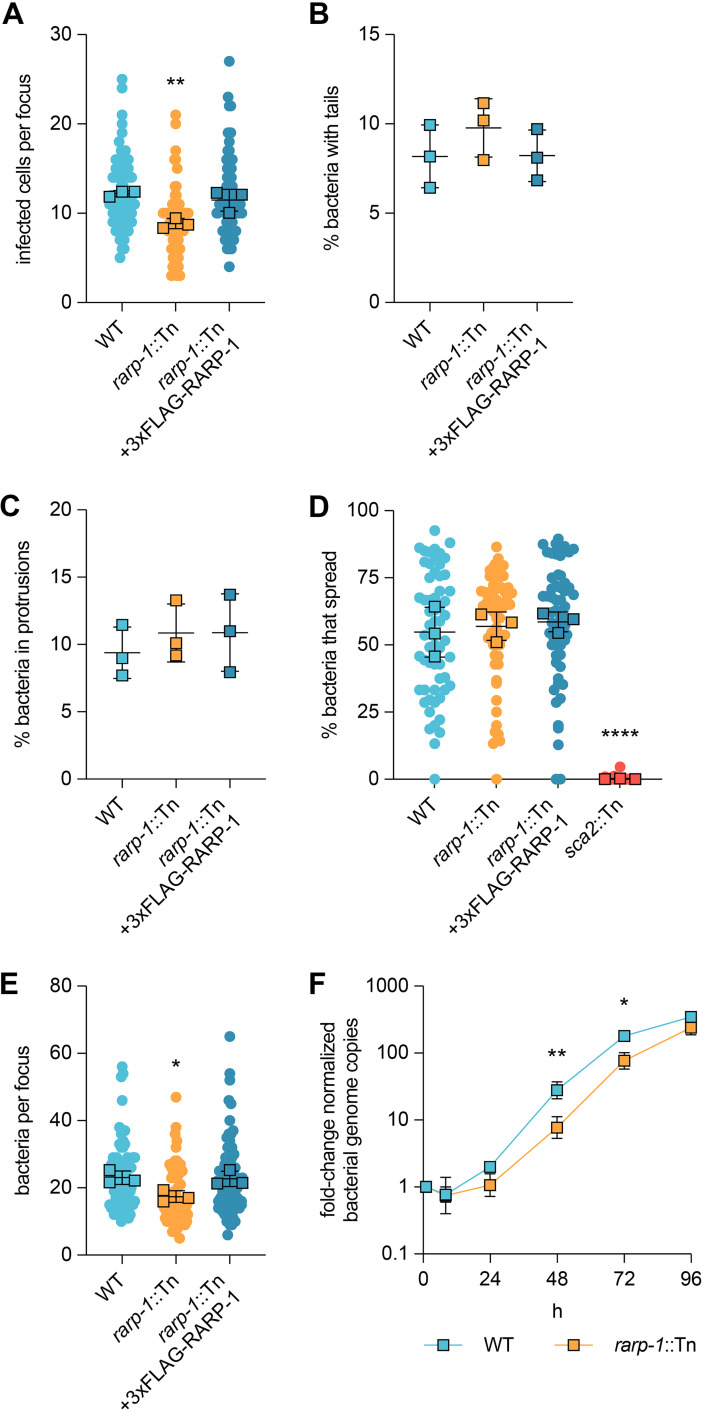
RARP-1 supports bacterial growth and is dispensable for cell-to-cell spread. (A) Infected cells per focus during infection of A549 cells. The means from three independent experiments (squares) are superimposed over the raw data (circles) and were used to calculate the means ± SD and P values (one-way ANOVA with post hoc Dunnett’s test). **, P < 0.01 relative to WT. (B) Percentage of bacteria with actin tails during infection of A549 cells. (C) Percentage of bacteria within a protrusion during infection of A549 cells. In panels B and C, the percentages were determined from three independent experiments (≥380 bacteria were counted for each infection) and were used to calculate the means ± SD and P values (one-way ANOVA with post hoc Dunnett’s test). n.s., not significant relative to WT. (D) Percentage of bacteria per focus that spread from infected donor cells to uninfected recipient cells by mixed-cell assay in A549 cells. The means from three independent experiments (squares) are superimposed over the raw data (circles) and were used to calculate the means ± SD and P values (one-way ANOVA with post hoc Dunnett’s test). ****, P < 0.0001 relative to WT. The sca2::Tn mutant was used as a positive control. (E) Bacteria per focus during infection of A549 cells. The means from three independent experiments (squares) are superimposed over the raw data (circles) and were used to calculate the means ± SD and P values (one-way ANOVA with post hoc Dunnett’s test). *, P < 0.05). These data correspond to the same set of infectious focus assays displayed in panel A. (F) Growth curves as measured by R. parkeri (17-kDa surface antigen) genome equivalents per Vero host cell (GAPDH) genome equivalent normalized to 1 h postinfection. The means ± SD for triplicate samples from a representative experiment were compared at each time point after log2 transformation (unpaired two-tailed t test). *, P < 0.05; **, P < 0.01 relative to WT.

