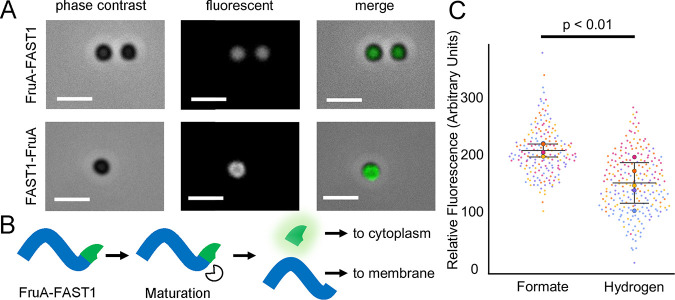
FIG 3.
Cellular localization and expression of N- and C-terminal translational fusions of FAST1 to FruA. (A) Images of N- and C-terminal FAST fusions to FruA. Bars = 2 μm. Arrows indicate the locations of fluorescent foci associated with the cell membrane. (B) Hypothesized maturation of the FruA peptide in the strain expressing fruA-FAST1. Maturation of FruA cleaves FAST off the mature hydrogenase. (C) Fluorescence intensities of FAST1-FruA cells grown in medium with either formate (184 cells) or H2 (236 cells) as the sole electron donor. Values were obtained by averaging the fluorescence intensities of single cells from each sample via microscopy. Relative fluorescence was normalized to correct for autofluorescence in the absence of fluorogen. Different circle colors represent data points from separate replicates, and mean values from all averaged cells in a replicate are represented by large circles. Data are averages and standard deviations from five independent cultures.

