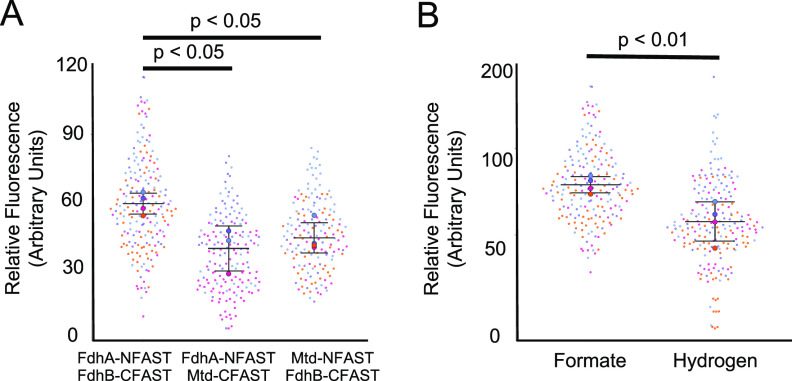
FIG 4.
BiFC and fluorescence of Fdh1 with splitFAST. (A) Fluorescence intensities of cells expressing various splitFAST constructs. The negative-control strains expressing fdhA-NFAST and mtd-CFAST (168 cells) and mtd-NFAST and fdhB-CFAST (160 cells) were compared to the strain expressing fdhA-NFAST and fdhB-CFAST (190 cells). Data were obtained using microscopy and are means and standard deviations from samples collected at least in triplicate. (B) Fluorescence intensities of cells expressing fdhA-NFAST and fdhB-CFAST grown in medium with either formate (190 cells) or H2 (183 cells) as the sole electron donor. Different circle colors represent data points from separate replicates, and mean values from all averaged cells in a replicate are represented by large circles. Data were obtained using microscopy and are means and standard deviations from quadruplicate samples.

