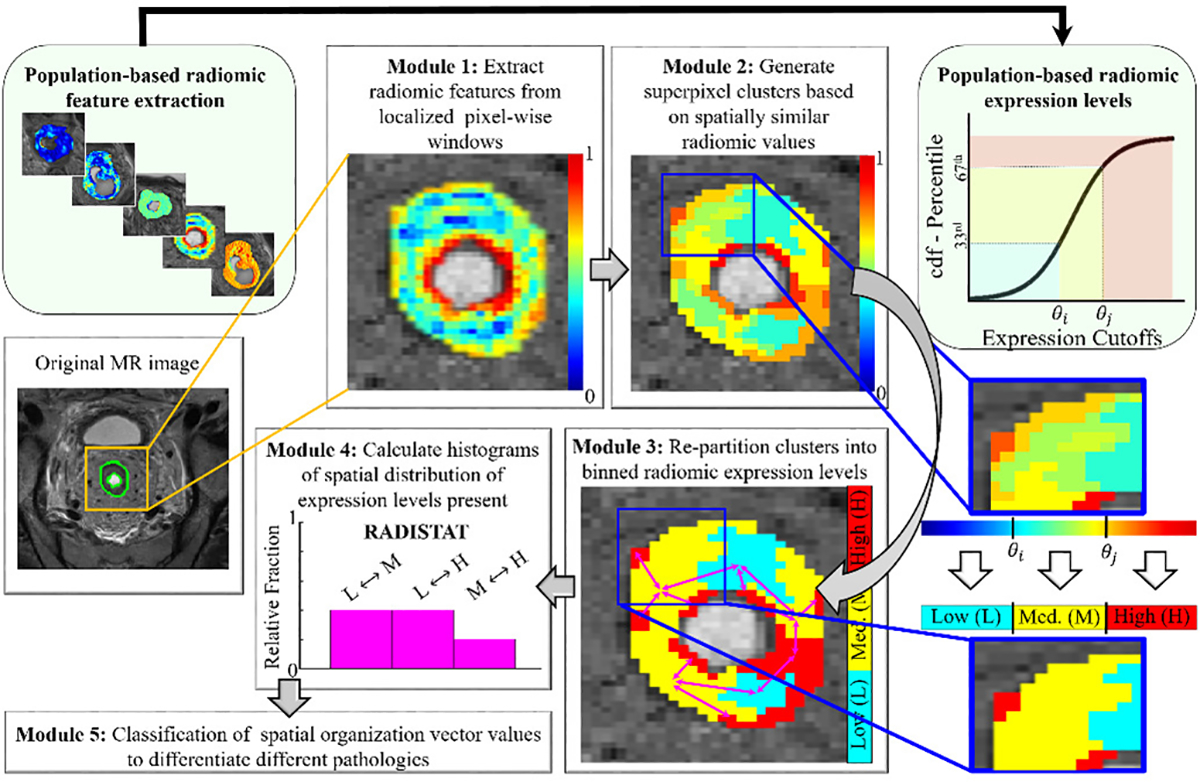
Fig. 2.

Overall workflow for extracting RADISTAT descriptor. Module 1 involves extracting radiomic features on a per-pixel basis within the region of interest (outlined in green), visualized here as a heatmap where red and blue correspond to high and low radiomic feature expression, respectively. In Module 2, superpixel-based clusters are computed from the radiomic expression map. The superpixel clusters are re-partitioned into a fixed number of binned expression levels in Module 3. The cutoff values for these binned radiomic expression levels is determined from population-based radiomic distributions (shown via connected light-green module blocks at the top). For ease of understanding, a representative re-partitioning of the radiomic map into 3 levels is shown alongside, e.g. low (L), medium (M), high (H)). Note that the number of levels in the RADISTAT partition map may be determined based on the application at hand. The final RADISTAT descriptor quantifies spatial adjacencies between pairwise combinations of expression levels (shown in Module 4). The RADISTAT descriptor can then be passed as a vector into a machine learning classifier for predicting different underlying pathologies (Module 5).
