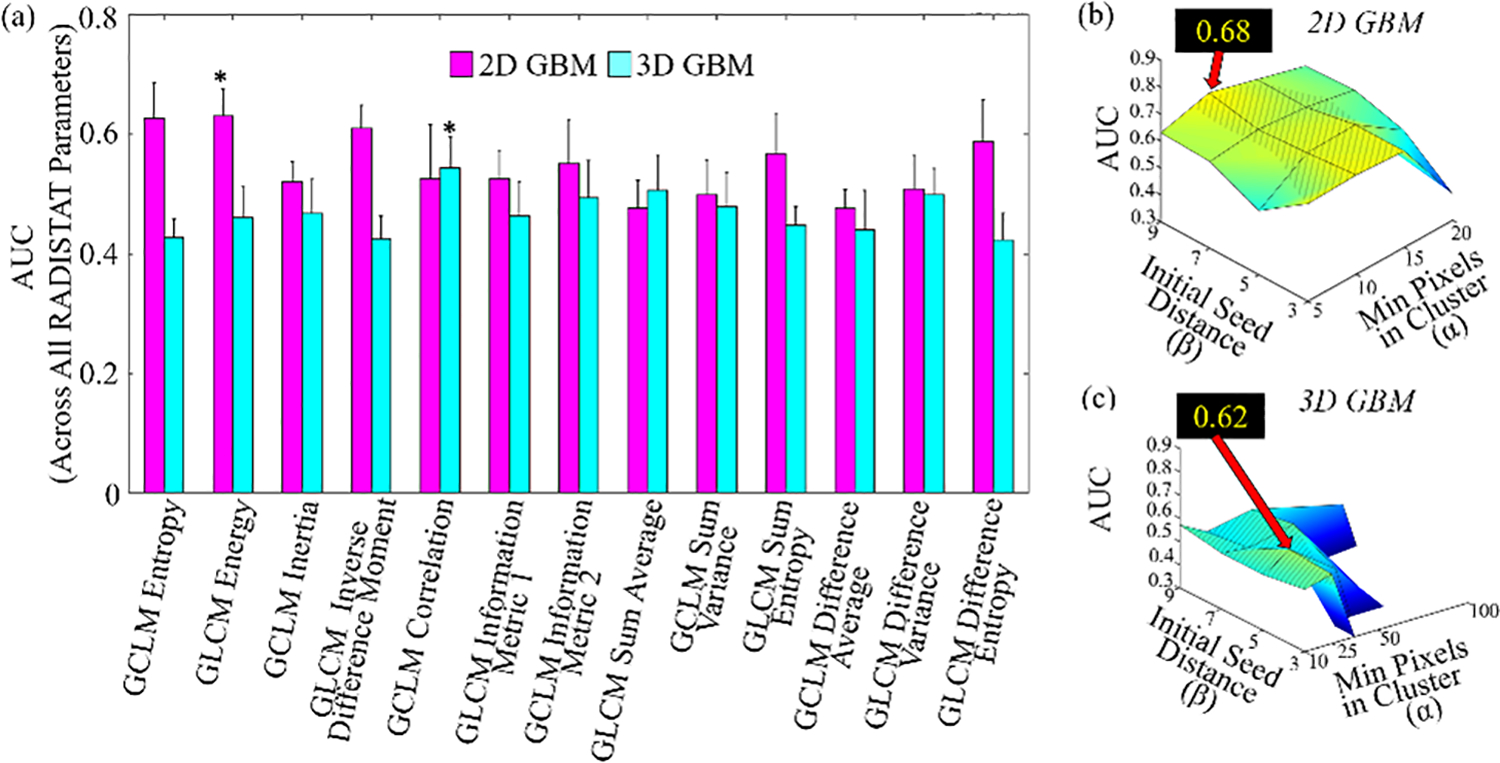
Fig. 6.

Bar plot summarizing mean AUCs achieved by RADISTAT in conjunction with each GLCM descriptor (, X-axis) averaged over all α-β combinations for the GBM classification task; for both 2D and 3D respectively. Error bars correspond to standard deviation in AUC over all α-β combinations. Asterisks denote the top-performing RADISTAT feature for each classification task. (b), (c) surface plots of AUC values of RADISTAT in 2D (top row) and 3D (bottom), for each classification task. Black call-out box in each subfigure corresponds to highest cross-validated AUC achieved in the discovery set, corresponding to different GLCM descriptors. Patterned gray lines indicate most stable performance of RADISTAT (within 1.5 times the standard deviation of the highest AUC).
