Fig. 3.
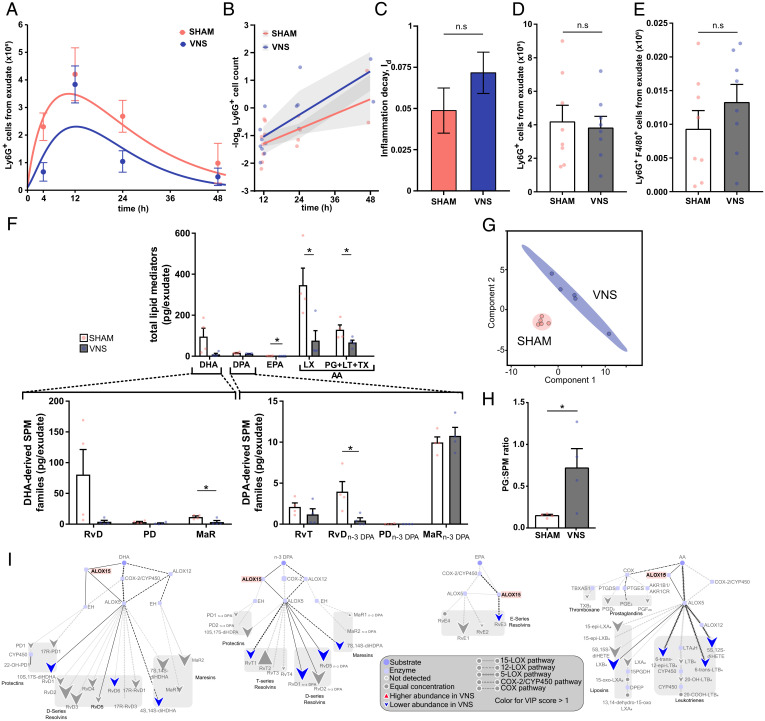
Alox15 was involved in vagus nerve–mediated regulation of resolution of inflammation. Alox15-deficient mice were subjected to either left cervical VNS or sham surgery followed by peritoneal injection of zymosan. Peritoneal exudates were collected at indicated time points after zymosan challenge and analyzed by flow cytometry. (A) Ly6G+ cells were plotted over time using an ODE model. (B) The loge cell counts (dots) plotted over time and linear regression analysis (lines), with shaded areas indicating the mean squared error. (C) Rate of inflammation resolution expressed as the inflammation decay (Id) in sham- (red) and VNS-treated (blue) mice. Results in A–C are from n = 2 experiments. (D) Peritoneal exudate Ly6G+ cell counts in sham- (red) and VNS-treated (blue) mice at 12 h after zymosan-induced peritonitis. (E) Efferocytosis plotted as absolute numbers of F4/80+Ly6G+ cells measured by flow cytometry following fixation and intracellular Ly6G staining of peritoneal exudate collected at 12 h after zymosan-induced peritonitis. Results in D and E are from n = 3 experiments. (F) Levels of total LMs identified in peritoneal exudate collected at 12 h after zymosan-induced peritonitis from the major bioactive metabolome families DHA, DPA, EPA, and AA (LX and PG + LT + TX). Levels of identified DHA-derived SPM families (Lower Left) and n-3 DPA–derived SPM families (Lower Right) in peritoneal exudates from VNS- (blue dots and gray bars) and sham-treated (red dots and open bars) Alox15-deficient mice are shown. Concentrations of identified and quantified LMs were analyzed using PLS-DA, generating (G) a two-dimensional score plot of LMs identified in peritoneal exudates from VNS- (blue) and sham-treated (red) mice. (H) Ratios of proinflammatory PGs to SPM in peritoneal exudates from VNS- (blue dots and gray bar) and sham-treated (red dots and open bar) Alox15-deficient mice. (I) LM profiles in VNS- and sham-treated Alox15-deficient mice were investigated using an interaction network pathway analysis. Results in F–I are from n = 2 experiments. Results in C–F are shown as mean ± SEM. n.s = not significant; *P < 0.05.

