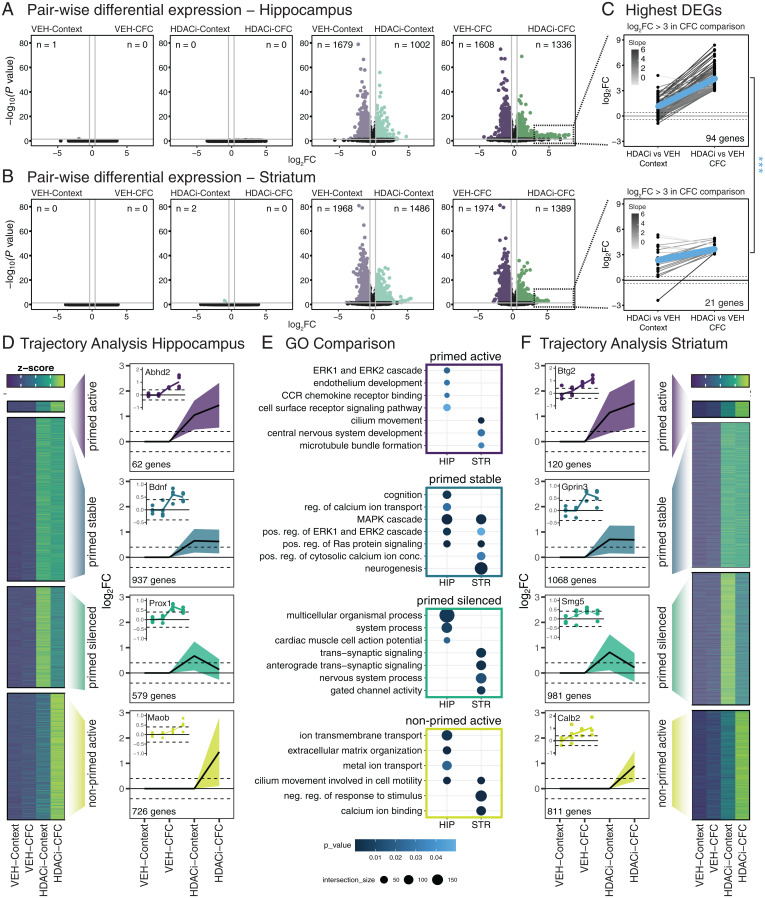
Fig. 2.
HDACi elicits brain region-specific transcriptional responses to CFC. (A and B) Volcano plots of differential expression versus statistical significance of pairwise comparisons labeled above each plot in the hippocampus (A) and striatum (B). The n values represent number of DEGs (log2FC ≥ 0.4; P ≤ 0.05). (C) Juxtaposition of the DEGs with log2FC ≥ 3 in the HDACi-CFC vs. VEH-CFC (Right column) comparison to those same genes in the HDACi-Context vs. VEH-Context (Left column) comparison in the hippocampus (Upper) and striatum (Lower). Lines are colored by log2FC difference between the two comparisons. The blue line represents the average slope. Student’s t test compares slopes between hippocampus and striatum. ***P < 0.001. (D) Heat map of z-scores of average gene counts in the hippocampus (Left). Line graphs in trajectory plots represent significant log2FC values for each cluster (Right). Count in lower left corner indicates number of genes in each cluster. Line plots shown as mean ± SEM. Representative DEGs from each cluster in inset. Normalized counts for each replicate were compared to average normalized count for VEH-Context. (E) GO analysis of hippocampal (Left) and striatal (Right) trajectories. (F) Gene cluster analysis for striatum RNA-seq data as in D. n = 4 biological replicates.

