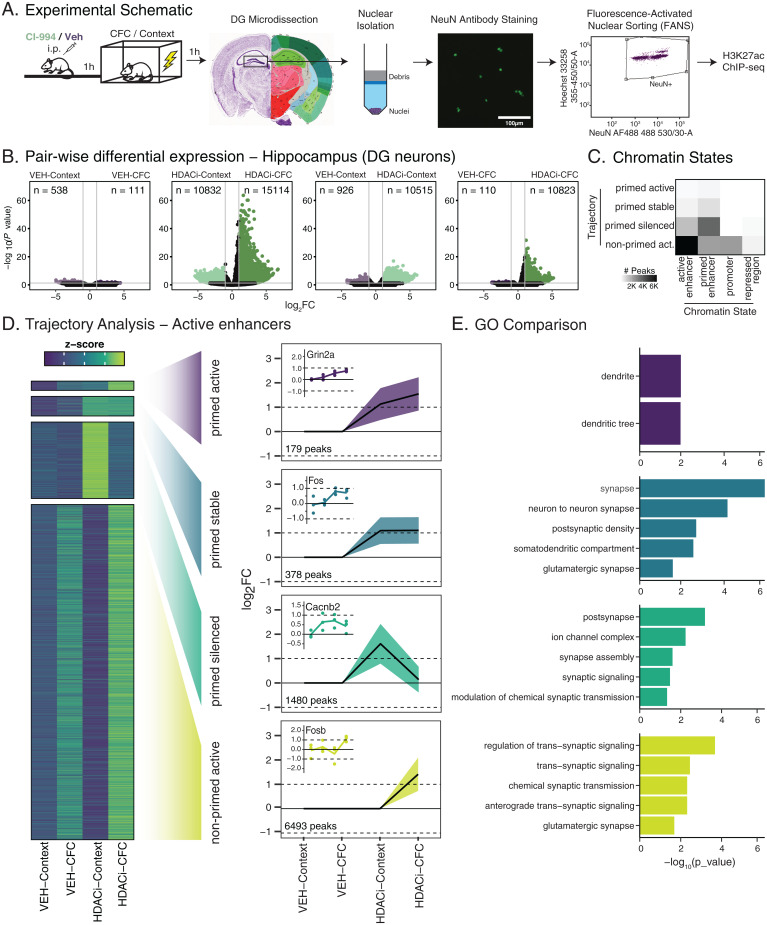
Fig. 4.
HDACi enriches H3K27ac at genes involved in neuronal synaptic communication. (A) Schematic of experimental outline. (B) Volcano plots showing differential H3K27ac enrichment versus statistical significance for pairwise comparisons (labeled above each plot). n values represent the number of peaks that are enriched (log2FC ≥ 1; FDR ≤ 0.05). P values were calculated by the Wald test and corrected for multiple comparisons using FDR. (C) Heat map representing number of peaks in the trajectories per chromatin state. (D) Heat map of z-scores of the average normalized H3K27ac peak counts for all four trajectories of interest. Peak sets underwent decision tree clustering based on significant log2FC values for associated peaks in each group when compared to VEH-Context. Line graphs in trajectory plots represent significant log2FC values for each group in clusters of interest. Count in lower left corner indicates number of peaks. Line plots shown as mean ± SEM. Insets represent differentially enriched active enhancer peaks from each cluster. Normalized counts for each replicate were compared to average normalized count for VEH-Context. (E) GO analysis of genes associated with H3K27ac peaks. n = 3 biological replicates (pooled 5 animals).

