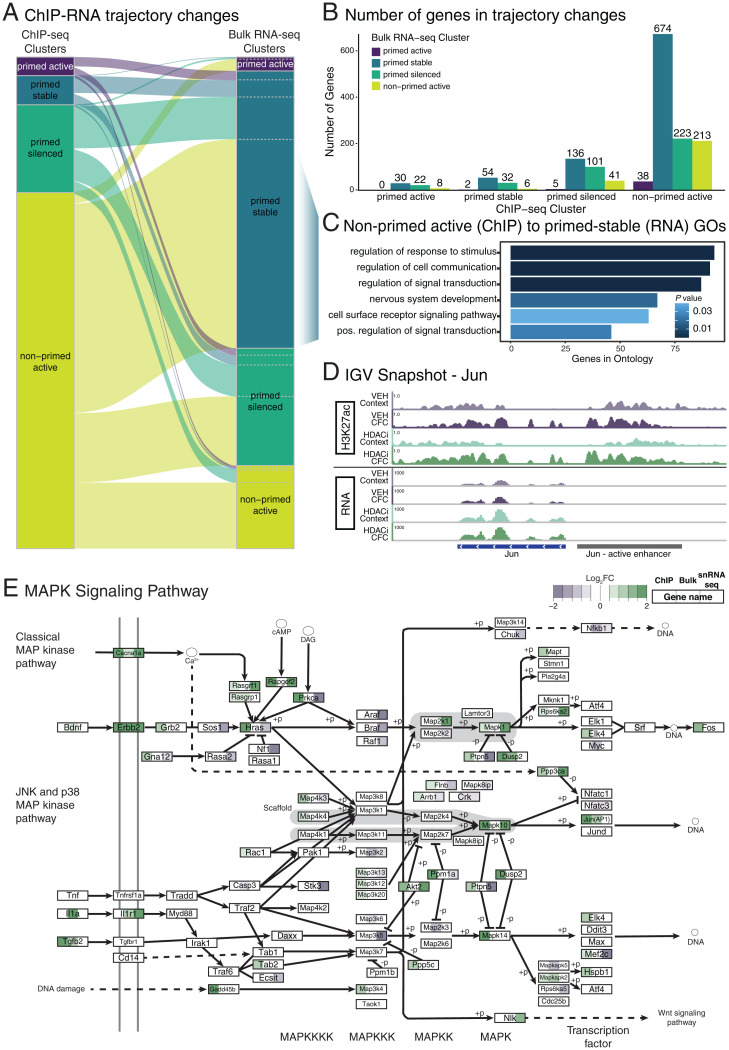
Fig. 5.
Overlap between HDACi-induced acetylation and transcriptional changes. (A) Sankey plot showing change in trajectory association for the 1,585 active enhancer-associated genes present in both the ChIP (Left) and bulk RNA-seq (Right). (B) Number of genes changing between ChIP-seq and the bulk RNA-seq clusters. (C) GOs for the 674 genes in the ChIP non-primed active cluster shifted to the RNA-seq primed stable cluster. (D) Example genome track of the H3K27ac and mRNA expression for Jun (active enhancer in gray and gene in blue). (E) KEGG visualization of the MAPK signaling pathway. Each box represents a gene for which the significant log2FC for the HDAC-CFC vs. VEH-CFC in the ChIP-seq (Left), bulk RNA-seq (Center), and snRNA-seq (Right) are color coded.

