
Figure 4.
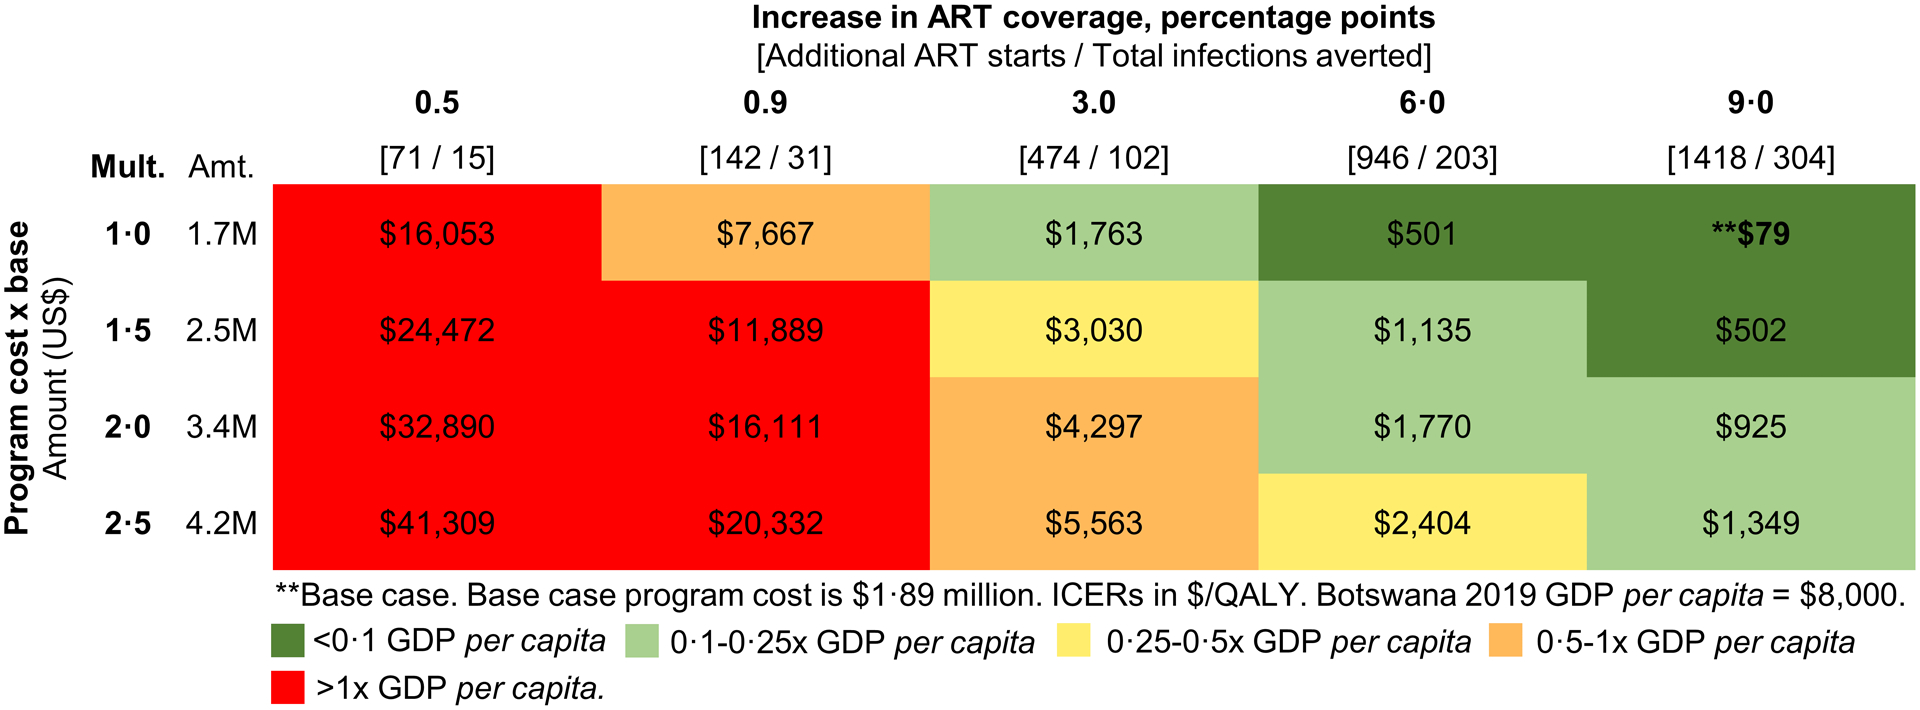
Two-way sensitivity analysis: Cost-effectiveness as a function of the incremental increase in ART coverage and the cost of the CP intervention.
This heat map reports the ranges of incremental cost-effectiveness ratios of CP vs. SOC as a function of the two most influential parameters in Figure 3: incremental cost of the CP intervention (vertical axis) and incremental increase in ART coverage and infections averted (horizontal axis). Colors indicate the incremental cost-effectiveness ratio achieved by each combination of these parameters, ranging from very cost-effective in green (<0.25x Botswana’s annual per capita GDP of $8,000) to cost-effective in yellow (0.25–0.5x GDP) and orange (0.5–1x GDP) and not cost-effective in red (>1x GDP). The base case combination (nine-percentage point incremental increase in ART coverage for an incremental CP cost of $1.7 million) is indicated by the ** in the upper left cell.
CP, combination prevention; SOC, standard of care; ART, antiretroviral therapy; ICER, incremental cost-effectiveness ratio; QALY, quality-adjusted life year; GDP, gross domestic product.