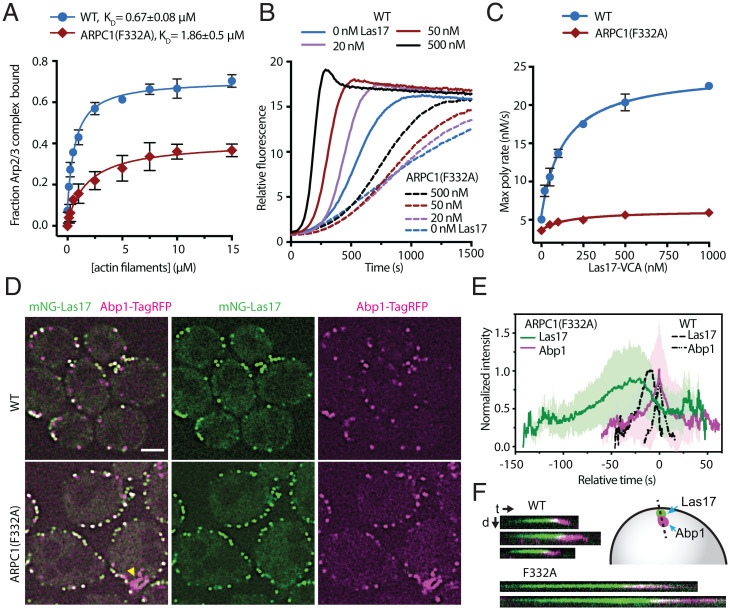
Fig. 7.
The ARPC1 insert is important for Arp2/3 complex function in vitro and in vivo. (A) Binding isotherm showing the fraction of 60 nM WT and mutant Arp2/3 complexes that copelleted with preformed actin filaments. Fraction bound was determined by measuring depletion of the Arp2/3 complex from the supernatant. Note that neither WT nor ARPC1(F332A) Arp2/3 complexes reach 100% bound even at saturating concentrations of actin filaments (see SI Appendix, Methods for more details). The F332 residue in S. cerevisiae is equivalent to F302 in B. taurus ARPC1. n = 3 for each concentration. Error bar: SD. (B) Time courses of pyrene actin polymerization for reactions containing 20 nM WT or ARPC1(F332A) mutant Arp2/3 complex and the indicated concentration of the VCA segment of Las17 (Las17-VCA). (C) Quantification of the maximum polymerization rate from the data in B. Data points are averages of three replicates. Error bars: SD. (D) Spinning disk confocal images of a central z-slice of WT or ARPC1(F332A) strains taken in optical pixel reassignment mode. Las17 is labeled at its N terminus with mNeonGreen (mNG), and Abp1 is labeled at its C terminus with TagRFP-T. Yellow arrowhead highlights a nonpunctate Abp1-TagRFP-T structure in the ARPC1(F332A) strain. Scale bar: 2.0 μm. (E) Plot of the average normalized intensity versus time for mNG-Las17 and Abp1-TagRFP-T patches in WT (n = 76 patches) and ARPC1(F332A) (n = 74 patches) cells. Paired trajectories were aligned at the maximum signal for Abp1-TagRFP-T. Error bars show the SD for all aligned trajectories. (F) Kymographs from widefield fluorescence images showing mNG-Las17 and Abp1-TagRFP-T signal over time for three events in WT and two events in the mutant cells. t, time; d, distance.

