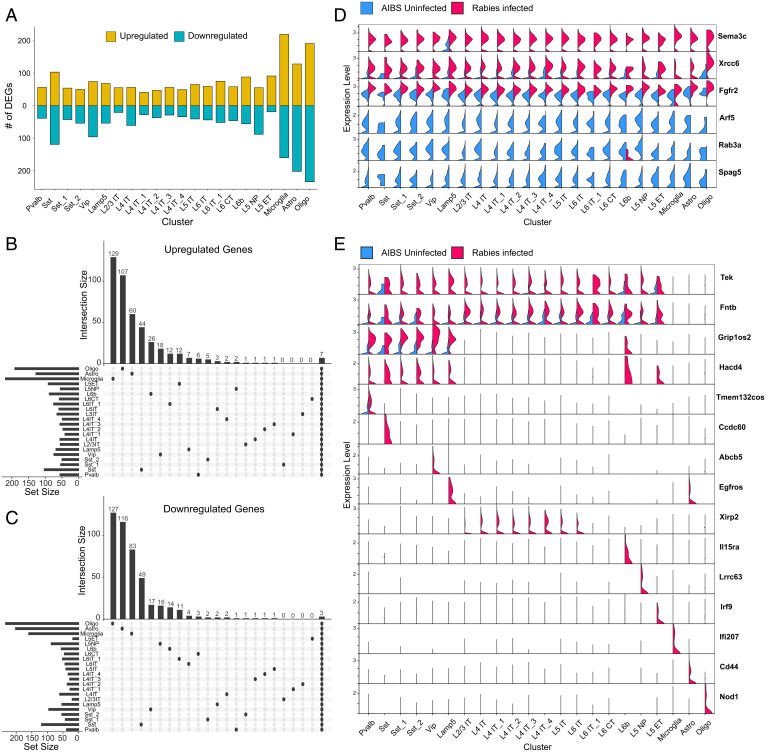
Fig. 4.
Cell-type–specific rabies-induced transcriptional changes. (A) Bar plot showing the number of DEGs that are up-regulated (yellow) or down-regulated (blue) in each cluster in rabies-infected nuclei compared with AIBS control. (B and C) Upset plots of up-regulated (B) and down-regulated (C) DEGs in rabies infected versus AIBS control. Horizontal bars represent the number of DEGs detected in each cluster, and vertical bars represent the number of unique DEGs in that cluster or in selected intersections between clusters indicated below the bars. (D) Violin plots displaying normalized expression of select DEGs in rabies-infected nuclei and AIBS control nuclei in each cluster. Top three genes are up-regulated in rabies-infected nuclei across all clusters and bottom three genes are down-regulated in rabies-infected nuclei across all clusters. (E) Violin plots displaying normalized expression of select DEGs in rabies-infected nuclei and AIBS control nuclei in each cluster. Genes are differentially expressed in neuronal clusters (top two rows), mainly inhibitory clusters (third row), or in unique clusters.

