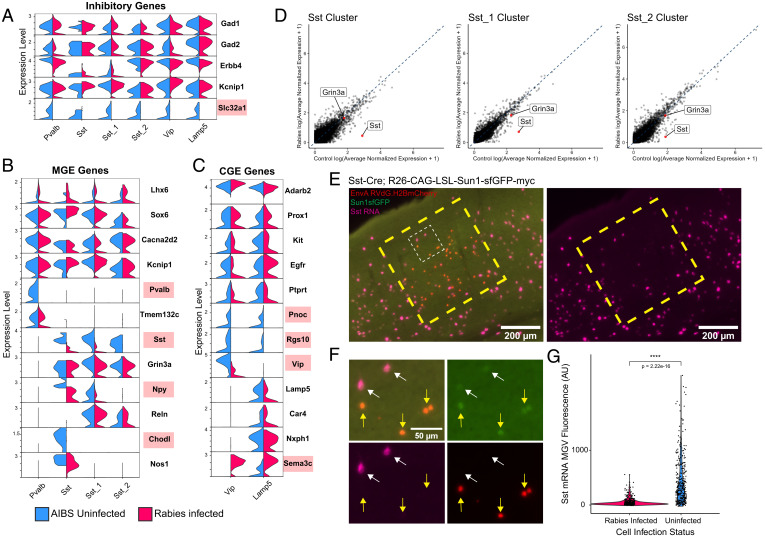
Fig. 5.
Rabies infection differentially affects the expression of inhibitory marker genes. (A–C) Violin plots displaying normalized expression of select inhibitory (A), MGE (B), or CGE (C), marker genes in rabies-infected nuclei and AIBS control nuclei in each cluster. Marker genes up-regulated or down-regulated in rabies-infected compared with AIBS control are highlighted in red. (D) Scatter plot displaying expression differences in rabies-infected nuclei versus AIBS control in Sst clusters, with Sst and Grin3a labeled in red. The dashed blue line indicates perfect correlation. Values were averaged log normalized across cells in each condition in that cluster. (E) Representative images of HCR labeling for Sst transcripts (magenta) in V1 of Sst Cre;R26-CAG-LSL-Sun1-sfGFP-myc mice injected with EnvA RVdG.H2BmCherry. Uninfected Sst neurons are Sun1sfGFP+, mCherry−, and rabies-infected Sst neurons are Sun1sfGFP+, mCherry+. Large dashed yellow box indicates a region containing rabies-infected Sst neurons. The small dashed white box indicates the region shown in F with higher magnification. Scale bar: 200 µm. (F) Higher magnification of dashed white box region in E. White arrows indicate uninfected Sst neurons (Sun1sfGFP+, mCherry−,) and yellow arrows indicate rabies-infected Sst neurons (Sun1sfGFP+, mCherry+). Sst transcripts labeled with HCR are in magenta. Scale bar: 50 µm. (G) Violin plots displaying MGV intensity of Sst transcript fluorescence. A total of 356 rabies-infected and 347 uninfected Sst neurons across 2 animals were analyzed. P values were determined by Wilcoxon rank-sum test. ****P ≤ 0.0001.

