Fig. 2.
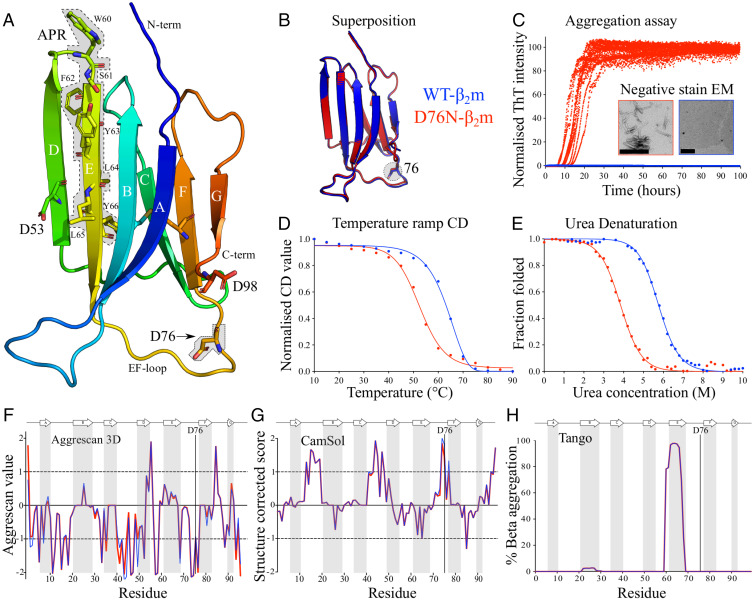
Comparison of the structure, stability, and amyloid propensity of WT- and D76N-β2m. (A) Crystal structure of WT-β2m (PDB [Protein Data Bank] 1LDS; ref. 61) highlighting Asp53, Asp76, Asp98, and the APR (residues 60 to 66 with gray background). The single disulphide bond linking Cys25 to Cys80 is also shown. Residue 76 is highlighted in stick and with a gray box. (B) Superposition of the crystal structure of WT- (PDB 1LDS; ref. 61) and D76N-β2m (PDB 4FXL; ref. 15) (RMSD of 0.33 Å over all heavy atoms). (C) ThT kinetics of the aggregation of WT- (blue) and D76N-β2m (red) (40 µM protein, 25 mM sodium phosphate pH 6.2, 115 mM NaCl, and 37 °C with agitation). Note the same color coding is used in all figure parts (WT- [blue] and D76N-β2m [red]). Ten replicates are shown. (Inset) Negative-stain EM micrographs of the endpoint of each sample are shown. Scale bar: 200 nm. (D) Apparent stability of WT- and D76N-β2m (20 µM) measured using thermal denaturation by far UV CD (25 mM sodium phosphate pH 6.2). (E) The thermodynamic stability monitored by urea titration using tryptophan fluorescence (see SI Appendix, Table S1). (F–H) Predictions of the aggregation propensity of WT- and D76N-β2m using (F) structurally corrected Aggrescan 3D 2.0 (23, 24) (values > +1 indicate APRs and < −1 indicate aggregation-resistant regions [dotted black lines]), (G) structure-corrected CamSol (16) (values > +1 indicate soluble and < −1 indicate insoluble regions [dotted black lines]), and (H) sequence-based Tango (18) (values >5% correspond to an aggregation-prone sequence). Light gray vertical bars highlight the β-strands in the native structure. The PDB codes used are 1LDS (61) for WT-β2m and 4FXL (15) for D76N-β2m, where residue M0 was removed and residues R97, D98, and M99 were added to 1LDS (61) to ensure a similar number of residues to compare with D76N-β2m.

