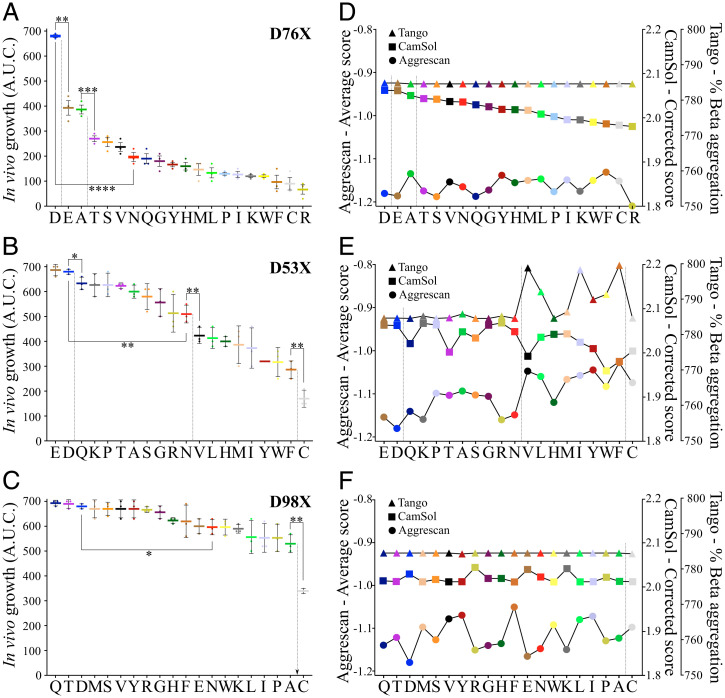
Fig. 3.
Saturation mutagenesis of β2m at positions 76, 53, or 98. (A–C) In vivo growth score (AUC) of the 20 (A) D76X-, (B) D53X-, or (C) D98X-β2m variants. In each case, the residues are ordered from highest to lowest in vivo growth score. Data represent mean values (n = 3 biologically independent experiments), where each point corresponds to one experiment. The error bar shows one SD from the mean. Asterisks denote significance (t-test: paired two sample for means, two-tail) where *P = 0.03, **P = 0.01, ***P = 0.003, and ****P = 0.002. (D–F) Aggrescan 3D 2.0 (23, 24), structurally corrected CamSol (16), and sequence-based Tango (18) score for each variant. The vertical black lines demark the different groups that are statistically different (P > 0.05). Each amino acid type is colored the same in the six plots and ordered in the same way for D76X- (A and D), D53-X (B and E), or D98X- (C and F). Note that the Asp (“D”) corresponds to the amino acid in WT-β2m.

