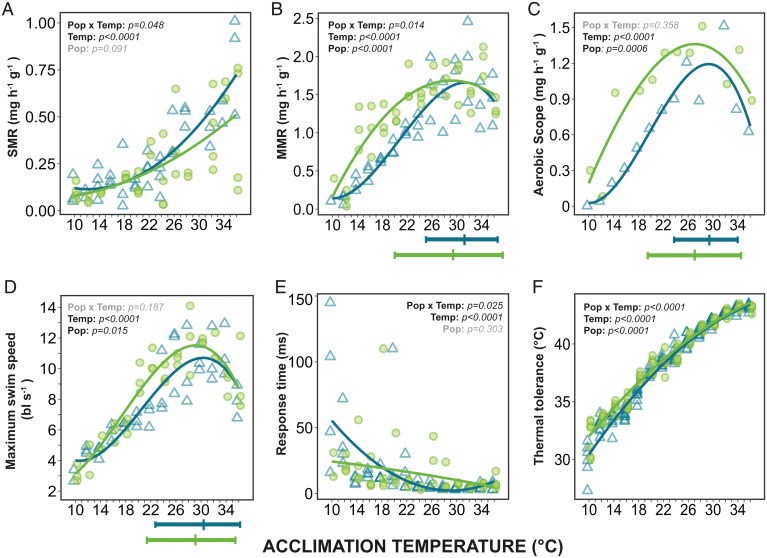
Fig. 2.
Thermal performance curves of wild and laboratory zebrafish for metabolic rates and other physiological traits after acclimation to temperatures from 10 °C to 36 °C. (A) Standard metabolic rate (SMR), each point represents an individual fish. (B) Maximum metabolic rate (MMR), each point represents a group of six fish (measured together). (C) Aerobic scope, the difference between mean MMR and mean SMR. (D) Maximum swim speed (body lengths sec−1) where each point represents a group of six fish. (E) Response time (latency to respond to a stimulus), each point represents the median response time of an individual fish. (F) Thermal tolerance (using the critical thermal maxima method: CTmax) of individual fish. Optimal temperatures for performance and thermal performance breadths (80% performance) are illustrated beneath (B–D) and exact values as shown in SI Appendix, Table S7. The P values for the statistical models are indicated on each panel: Temp, effect of temperature on trait; Pop, difference between wild (light green circles) and laboratory (blue triangles) fish (intercept at 23 °C); and Pop × Temp, interaction (see SI Appendix, Tables S1 and S2).

