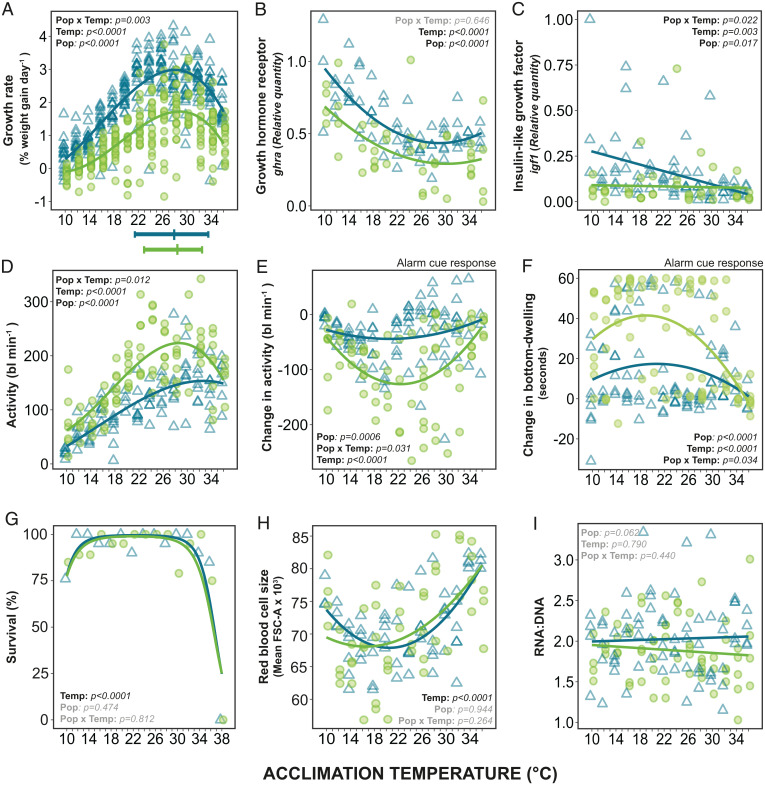
Fig. 4.
Growth, behavior, survival, and cell size in wild (green circles) and laboratory (blue triangles) zebrafish acclimated from 10 °C to 36 °C. Growth rate (A–C): (A) specific growth rate for weight for each individual fish; (B) relative quantity of growth hormone receptor α (ghra) in muscle tissue; and (C) relative quantity of insulin-like growth factor 1 (igf) in muscle tissue. Behavioral (D–F): (D) swimming activity (body lengths [bl] moved per minute) for individual fish prealarm cue; (E) change in activity in response to an alarm cue; and (F) change in time bottom-dwelling (sec min−1) in response to alarm cue, compared with prealarm cue. Survival (G): percentage survival of wild and laboratory fish after 35 d of acclimation to temperatures from 10 to 38 °C. (H) Red blood cell size (FSC-A). (I) RNA:DNA ratio (proxy of current growth). Maximum performance and upper and lower thermal performance breadths (80% performance) are illustrated beneath (A). Statistically significant differences indicated on each panel: Temp, significant effect of temperature on trait; Pop, significant difference between wild and laboratory fish (at 23 °C); Pop × Temp, significant interaction (see SI Appendix, Tables S1, S2, and S5).

