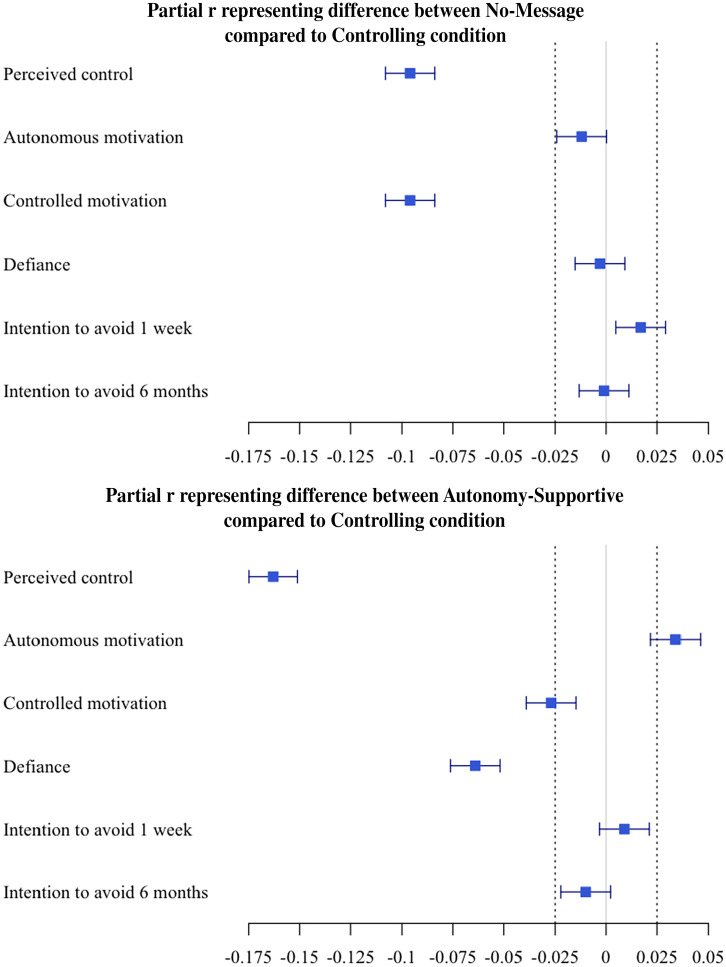
Fig. 3.
Illustrating confirmatory effects testing Hypothesis 1. Effect sizes are drawn from intercept-only models in Table 2 (n = 25,718). Values to the left of zero indicate that no message (or the autonomy-supportive message) yielded lower scores on outcomes than the controlling message. Values to the right of zero indicate that no message (or the autonomy-supportive message) yielded higher scores on those outcomes than the controlling message. The square represents the observed effect size, and the whiskers represents the 95% CIs; if the effect and its 95% CI fall outside the dotted lines (the interval null of rp = −0.025 to 0.025), the effect is considered practically meaningful.

