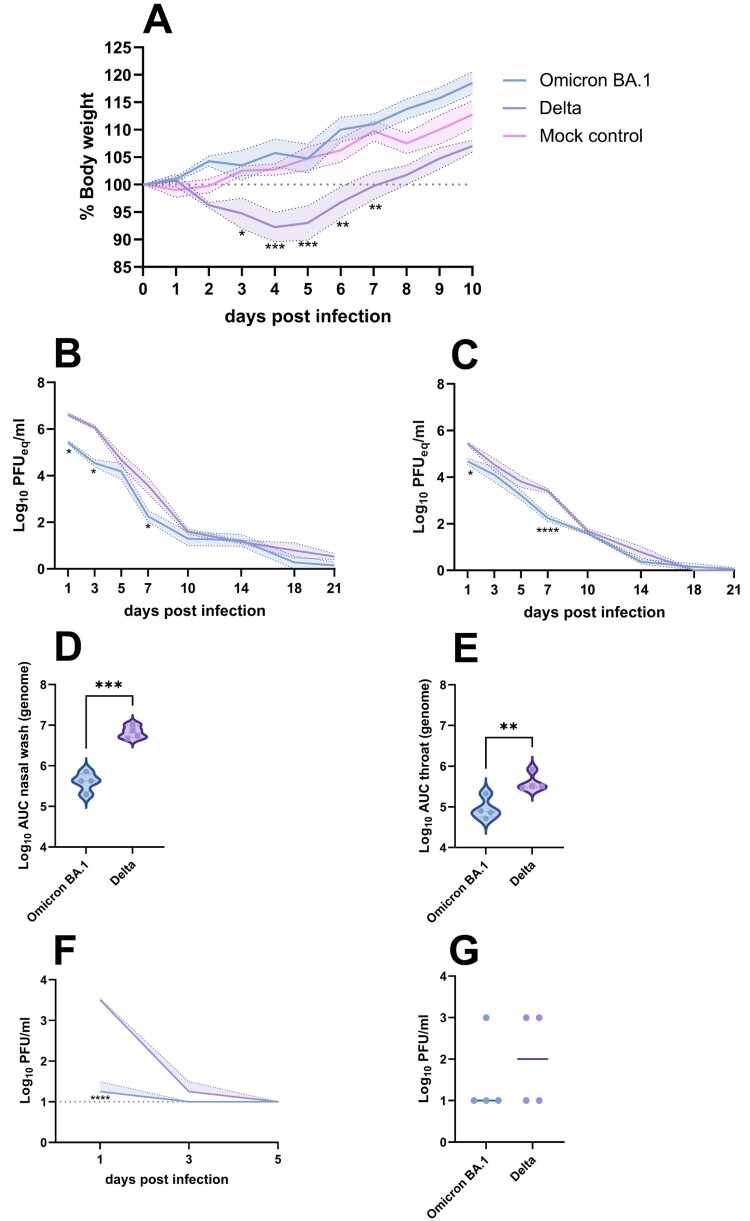
Figure 1.
Clinical manifestation and shedding after Omicron BA.1 and Delta inoculation. (A) Relative body weight of hamsters inoculated with Omicron BA.1, Delta and mock-inoculated hamsters. The mean of each group is shown as solid line, SEM displayed as shading. Significant statistical differences between the three groups were calculated with a 2-way ANOVA with Tukey’s multiple comparison test. Significant differences to the mock control are indicated with * (*p < 0.05; **p < 0.01; ***p < 0.001). (B,C) Kinetics of respiratory shedding detected in (B) nasal washes and (C) throat swabs . The mean of each group is shown as solid line, SEM displayed as shading. Significant statistic differences (*p < 0.05; ****p < 0.0001) were calculated with 2-way ANOVA with Dunnett’s correction for multiple comparisons. (D,E) Cumulative shedding depicted as area under the curve (AUC) in (D) nasal washes and (E) throat swabs. Significant statistic differences were calculated with unpaired t-test (**p < 0.01; ***p < 0.001).(F,G) Detection of infectious virus. (F) Infectious virus in nasal washes. The mean of each group is shown as solid line, SEM displayed as shading. Significant statistic differences (****p < 0.0001) were calculated with 2-way ANOVA with Dunnett’s correction for multiple comparisons. (G) Infectious virus in throat swabs at 1 dpi. The mean of each group is depicted as horizontal line. Significant statistic differences were calculated with unpaired t-test.

