Figure 2.
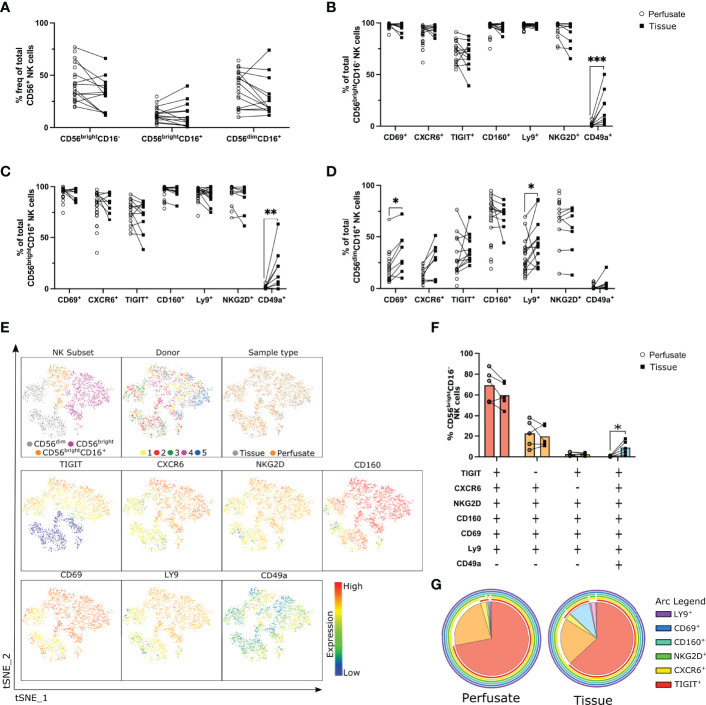
Co-expression of CD69, CXCR6, TIGIT, CD160, Ly9 and NKG2D defines a liver-resident CD56bright NK cell subset. Flow cytometry analysis liver-residency associated markers on NK cell subsets in liver perfusate and tissue samples (n = 5-25). (A), Frequency of NK cell subsets in liver perfusate and tissue samples (n = 5-25, matched samples indicated with a line). (B, D), Percent frequency of CD69+, CXCR6+, TIGIT+, CD160+, Ly9+, NKG2D+, and CD49a+ CD56brightCD16- (B), CD56brightCD16+ (C), and CD56dimCD16- (D) NK cells in perfusate and tissue samples. (E), tSNE analysis of NK cells from 5 matched liver perfusate and tissue samples visualising CD56bright (CD16-), CD56brightCD16+, and CD56dim (CD16+) NK cell subsets’ distinct cell surface receptor expression patterns. (F, G), SPICE analysis visualising co-expression of cell surface receptors on CD56brightCD16- NK cells in matched liver perfusate and tissue samples represented as a scatter plot (F) and a pie chart (G). Data analysed using an unpaired Mann-Whitney test (B–D) or a paired t test (F). * p< 0.05, **p < 0.01, ***p < 0.001.

