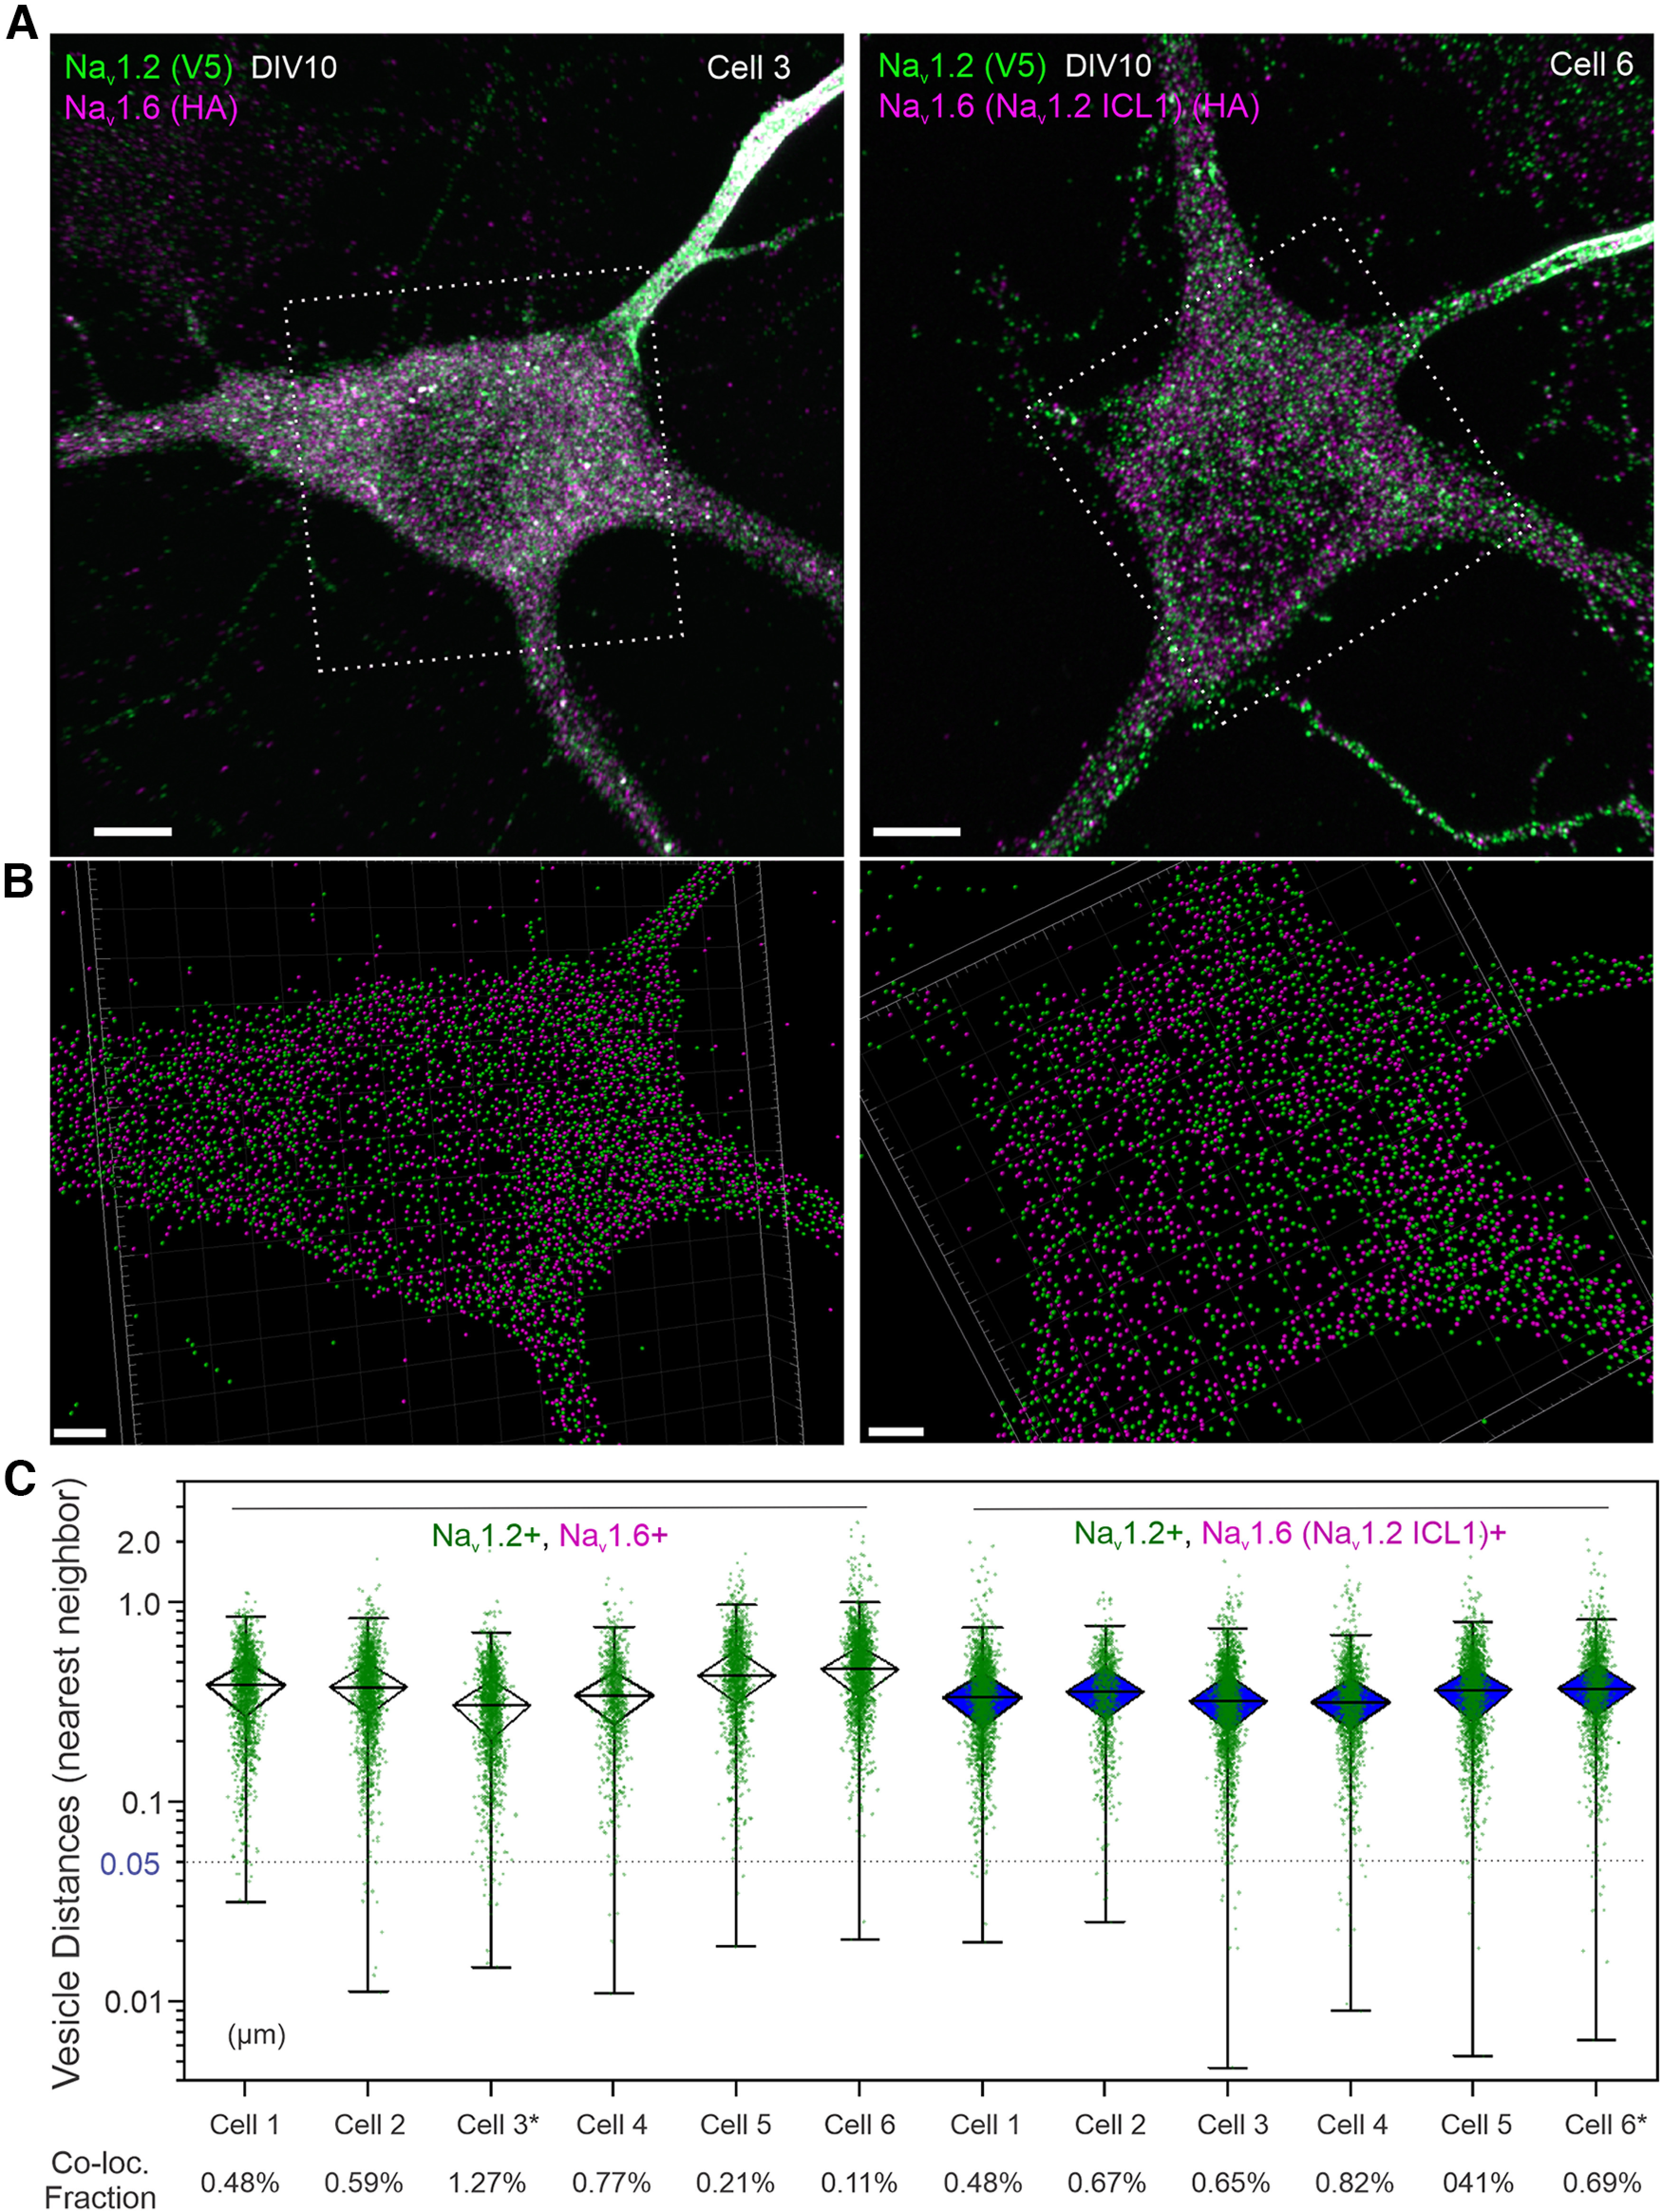
Figure 10.

Characterizing the role of ICL1 in protein sorting. A, Left, Airyscan images of DIV10 neurons double labeled with Nav1.2 (V5, green) and Nav1.6 (HA, magenta); or, right, Nav1.2 (V5, green) and Nav1.6(Nav1.2 ICL1) (HA, magenta) by cotransfection with corresponding plasmids. Scale bar, 5 µm. B, Computer-aided vesicle segmentation. The frame corresponds to the dotted box in A. Scale bar, 2 µm. C, The distribution of physical distances (nearest neighbor) between Nav1.2- and Nav1.6-positive vesicle populations (Nav1.2 as the origin). In the box chart, top and bottom error bars represent the 95th and 5th percentiles, respectively; triangle represents the range from the 25th to 75th percentile; center line represents the median. The 50 nm dotted line is used as the cutoff for colocalization (Co-loc.). Bottom, The colocalization fraction (percentage) is indicated for each cell.
