Figure 13.

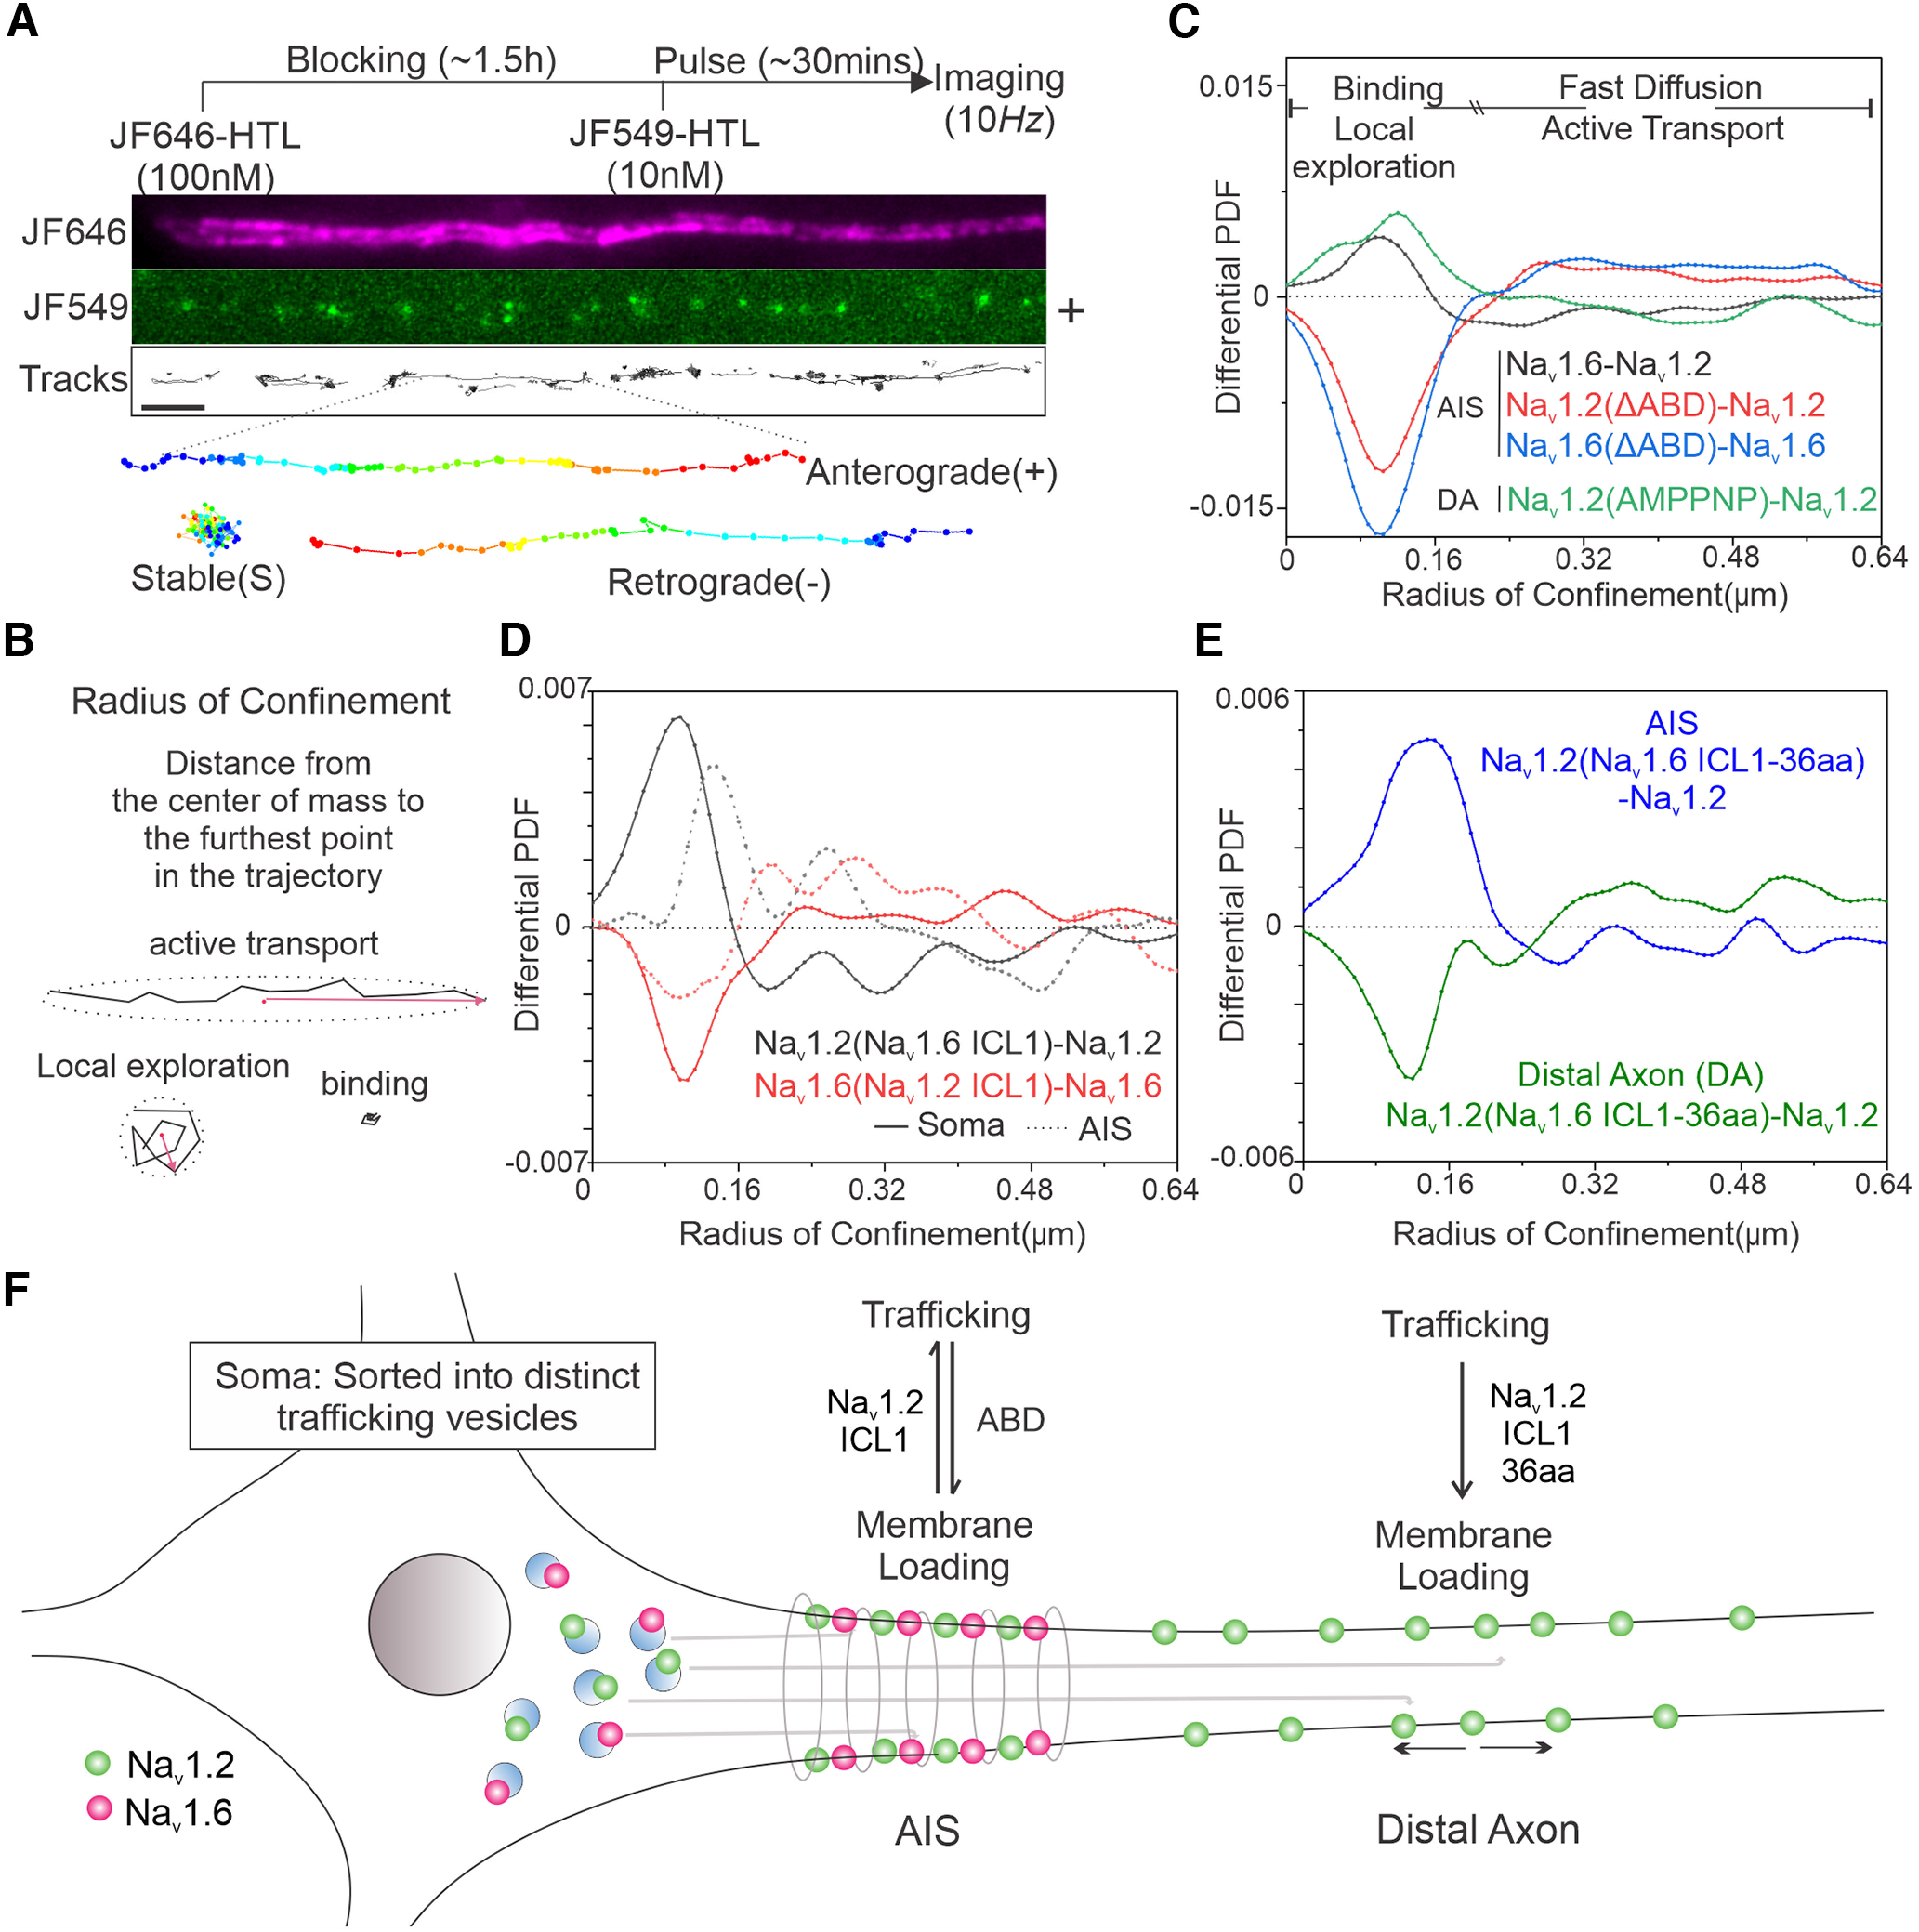
ICL1 mediates the targeting of Nav1.2 to the distal axon. A, Pulse-chase single-molecule imaging of Nav1.2. Top, Experimental flowchart. Middle, Representative AIS image, with JF646 bulk labeling image, JF549 pulse-chased single-molecule signals, and analyzed single-molecule moving trajectories. Bottom, Three different types of trajectories, stable binding, anterograde, and retrograde movement (blue to red color change represents time progression). Scale bar, 1 µm. B, Definition of RC for analyzing single-molecule moving dynamics. Stable binding and local exploration events have smaller RCs, whereas active transport and fast diffusion events should have larger RCs. C, Comparative RC distribution curves of Nav1.6–Nav1.2 (black curve), Nav1.2(ΔABD)–Nav1.2 (red curve), Nav1.6(ΔABD)–Nav1.6 (blue curve) in the AIS region and Nav1.2(AMPPNP)–Nav1.2 (green curve) in the distal axon. Differential PDF = 0 stands for equal fraction. D, Comparative RC distribution curves of Nav1.2(Nav1.6 ICL1)–Nav1.2 (black curve) and Nav1.6(Nav1.2 ICL1)–Nav1.6 (red curve) in soma (solid line) and AIS (dotted line). E, Comparative RC distribution curves of Nav1.2(Nav1.6 ICL1-36aa)–Nav1.2 in AIS (blue) and distal axon (green). F, A model diagram showing that Nav1.2 ICL1 is important for suppressing AIS anchoring and facilitating membrane insertion at the distal axon. Movie 6 shows representative single-molecule imaging movies of HaloTag-labeled Nav1.2 and Nav1.6.
