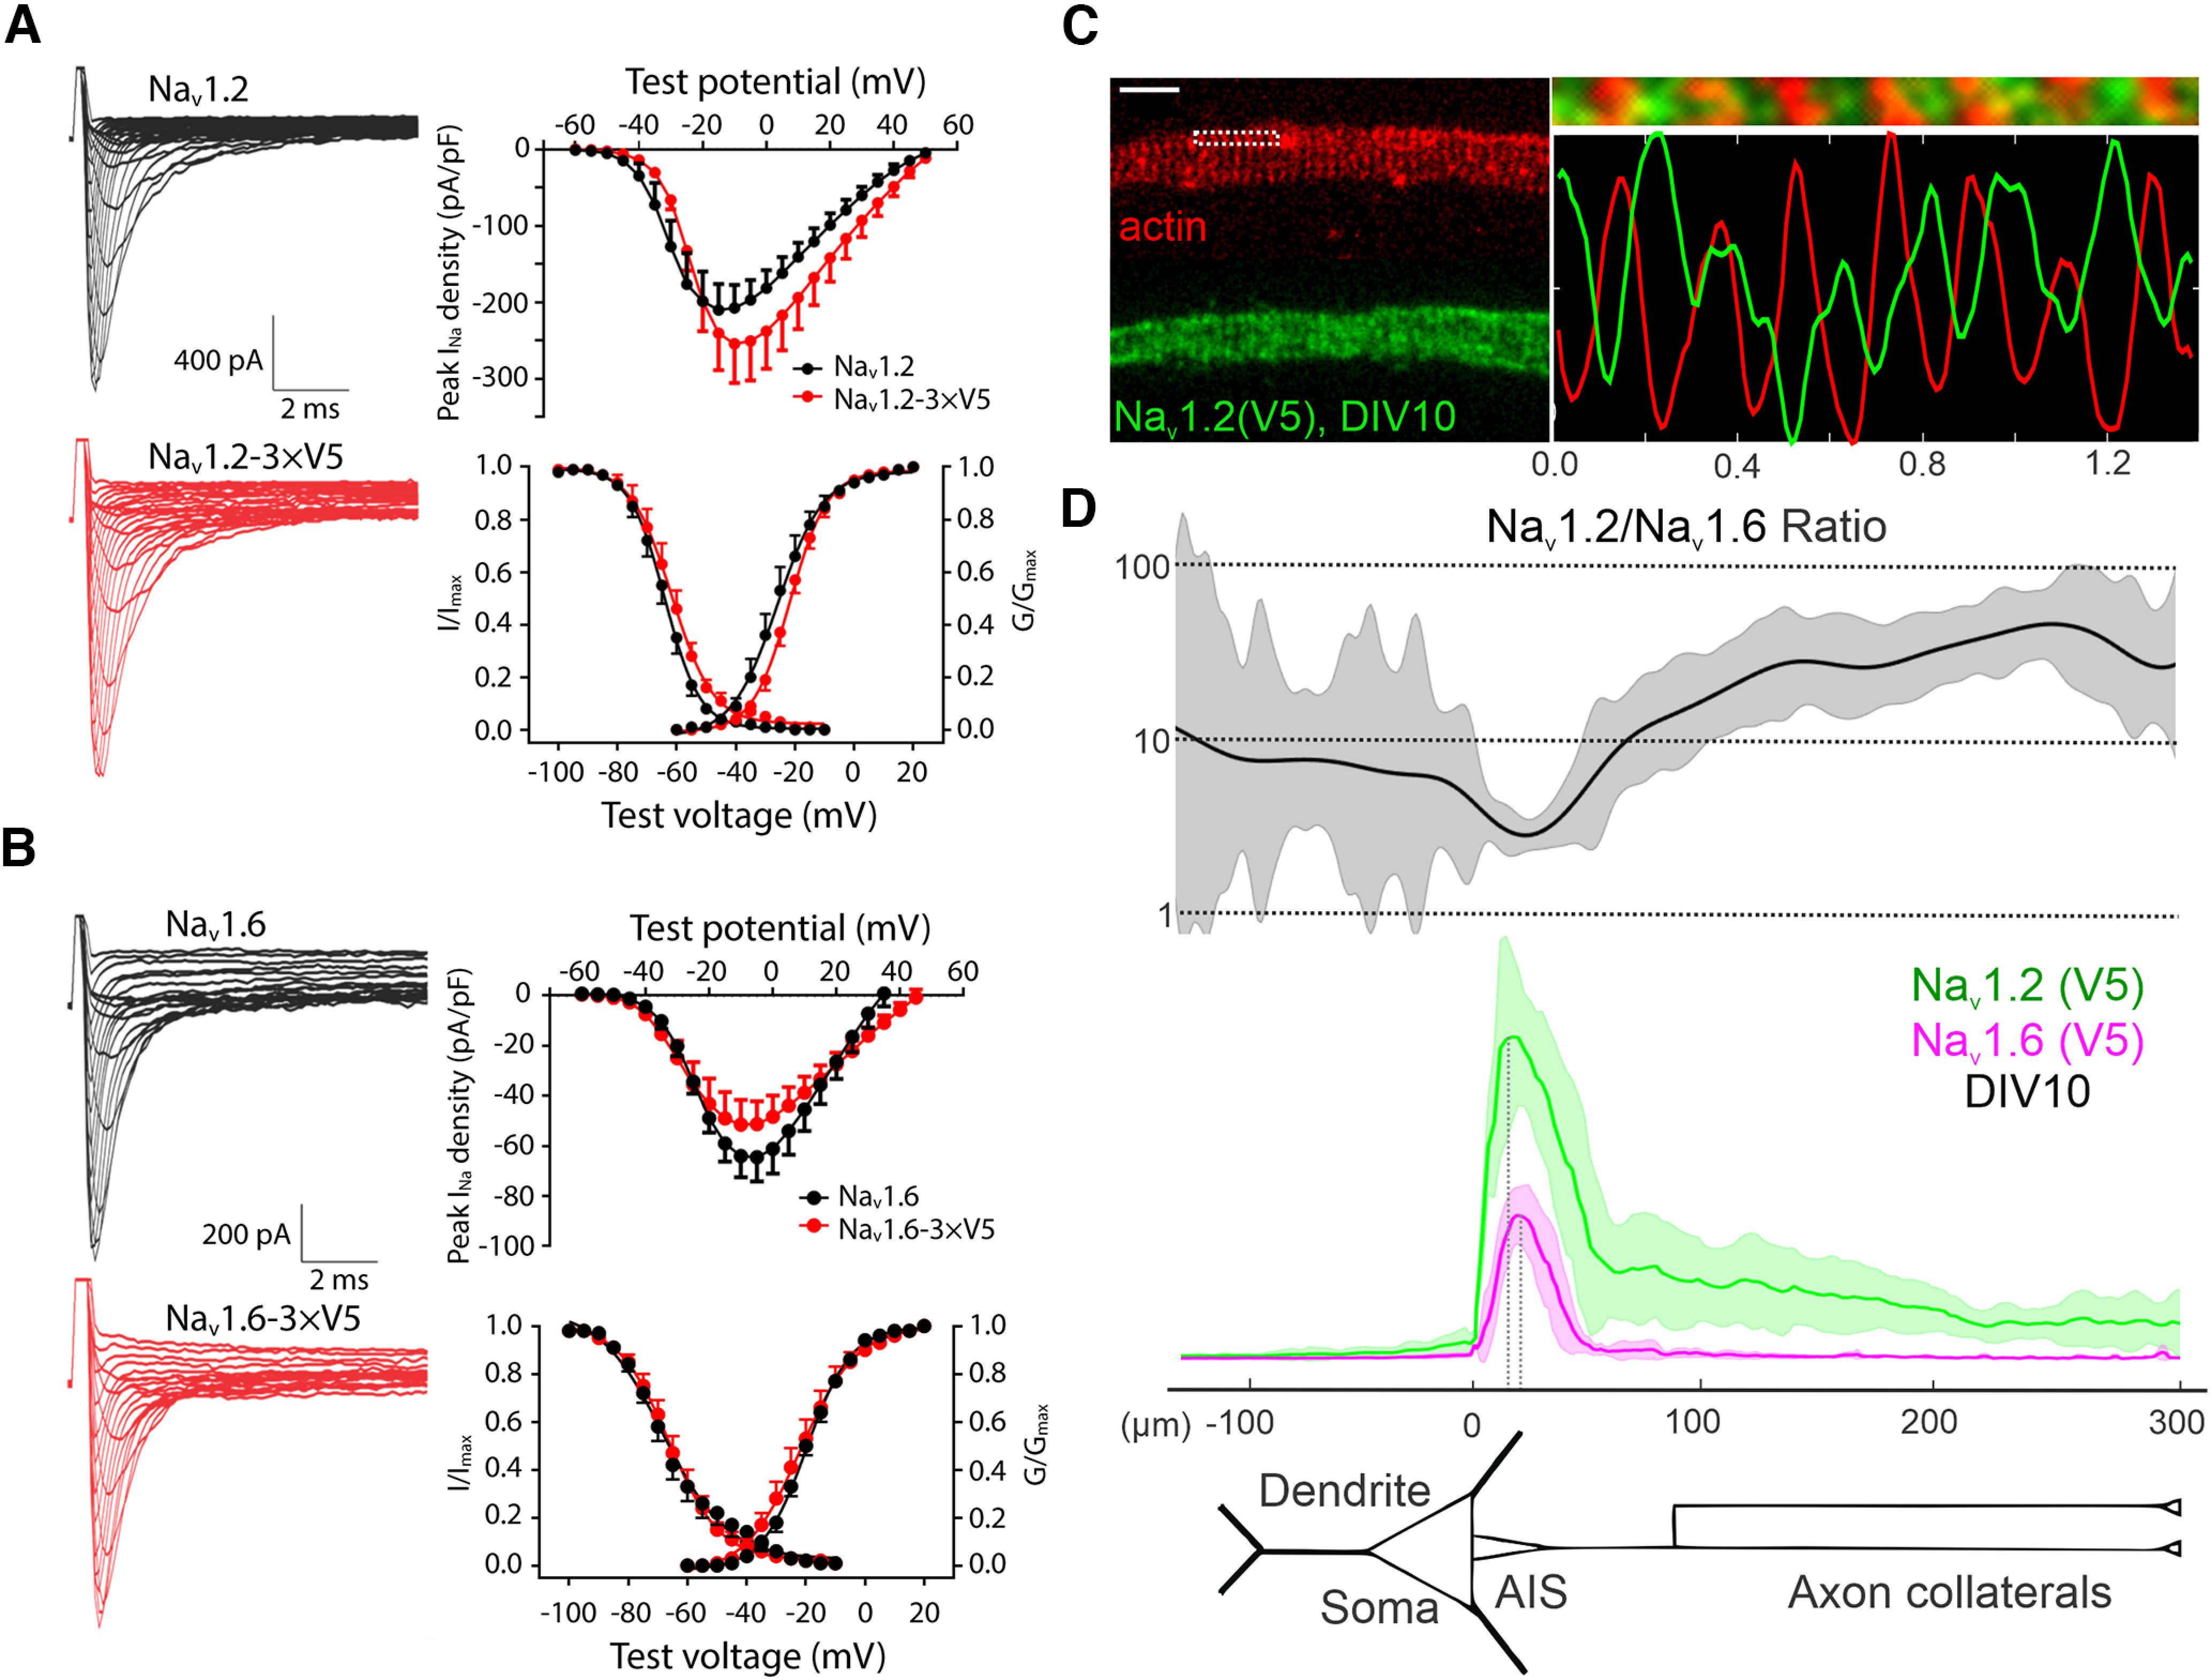
Figure 3.

Electrophysiological properties and subcellular distribution profiles of V5-labeled Nav1.2 and Nav1.6. A, WT (black) and V5-labeled (red) Nav1.2 in HEK293T cells. Left, Nav1.2 current examples. Right, Peak current density (top), channel activation (WT, n = 10; V5 labeled, n = 9), and steady-state inactivation (WT, n = 11; V5 labeled, n = 9) curves (bottom). B, WT (black) and V5 labeled (red) Nav1.6 in HEK293T cells. Left, Nav1.6 current examples. Right, Peak current density (top), channel activation (WT, n = 11; V5 labeled, n = 12) and steady-state inactivation (WT, n = 13; V5 labeled, n = 11) curves (bottom). C, Antiphase periodic striations of V5-labeled Nav1.2 and actin in the AIS region of cultured hippocampal neurons. Right, top, Zoomed-in view of the rectangle region with dashed lines in the left image. Bottom, The intensity curves of Nav1.2 (green) and actin (red) along the horizontal line. Scale bar, 1 µm. D, Analysis of Nav1.2 (n = 12) and Nav1.6 (n = 14) relative intensities along the dendrite and axon of cultured hippocampal neurons. Top, Curve shows the Nav1.2/Nav1.6 intensity ratio calculated by using Nav1.2 and Nav1.6 intensity data (middle). Error bars (shadow areas) represent SD.
