Figure 5.

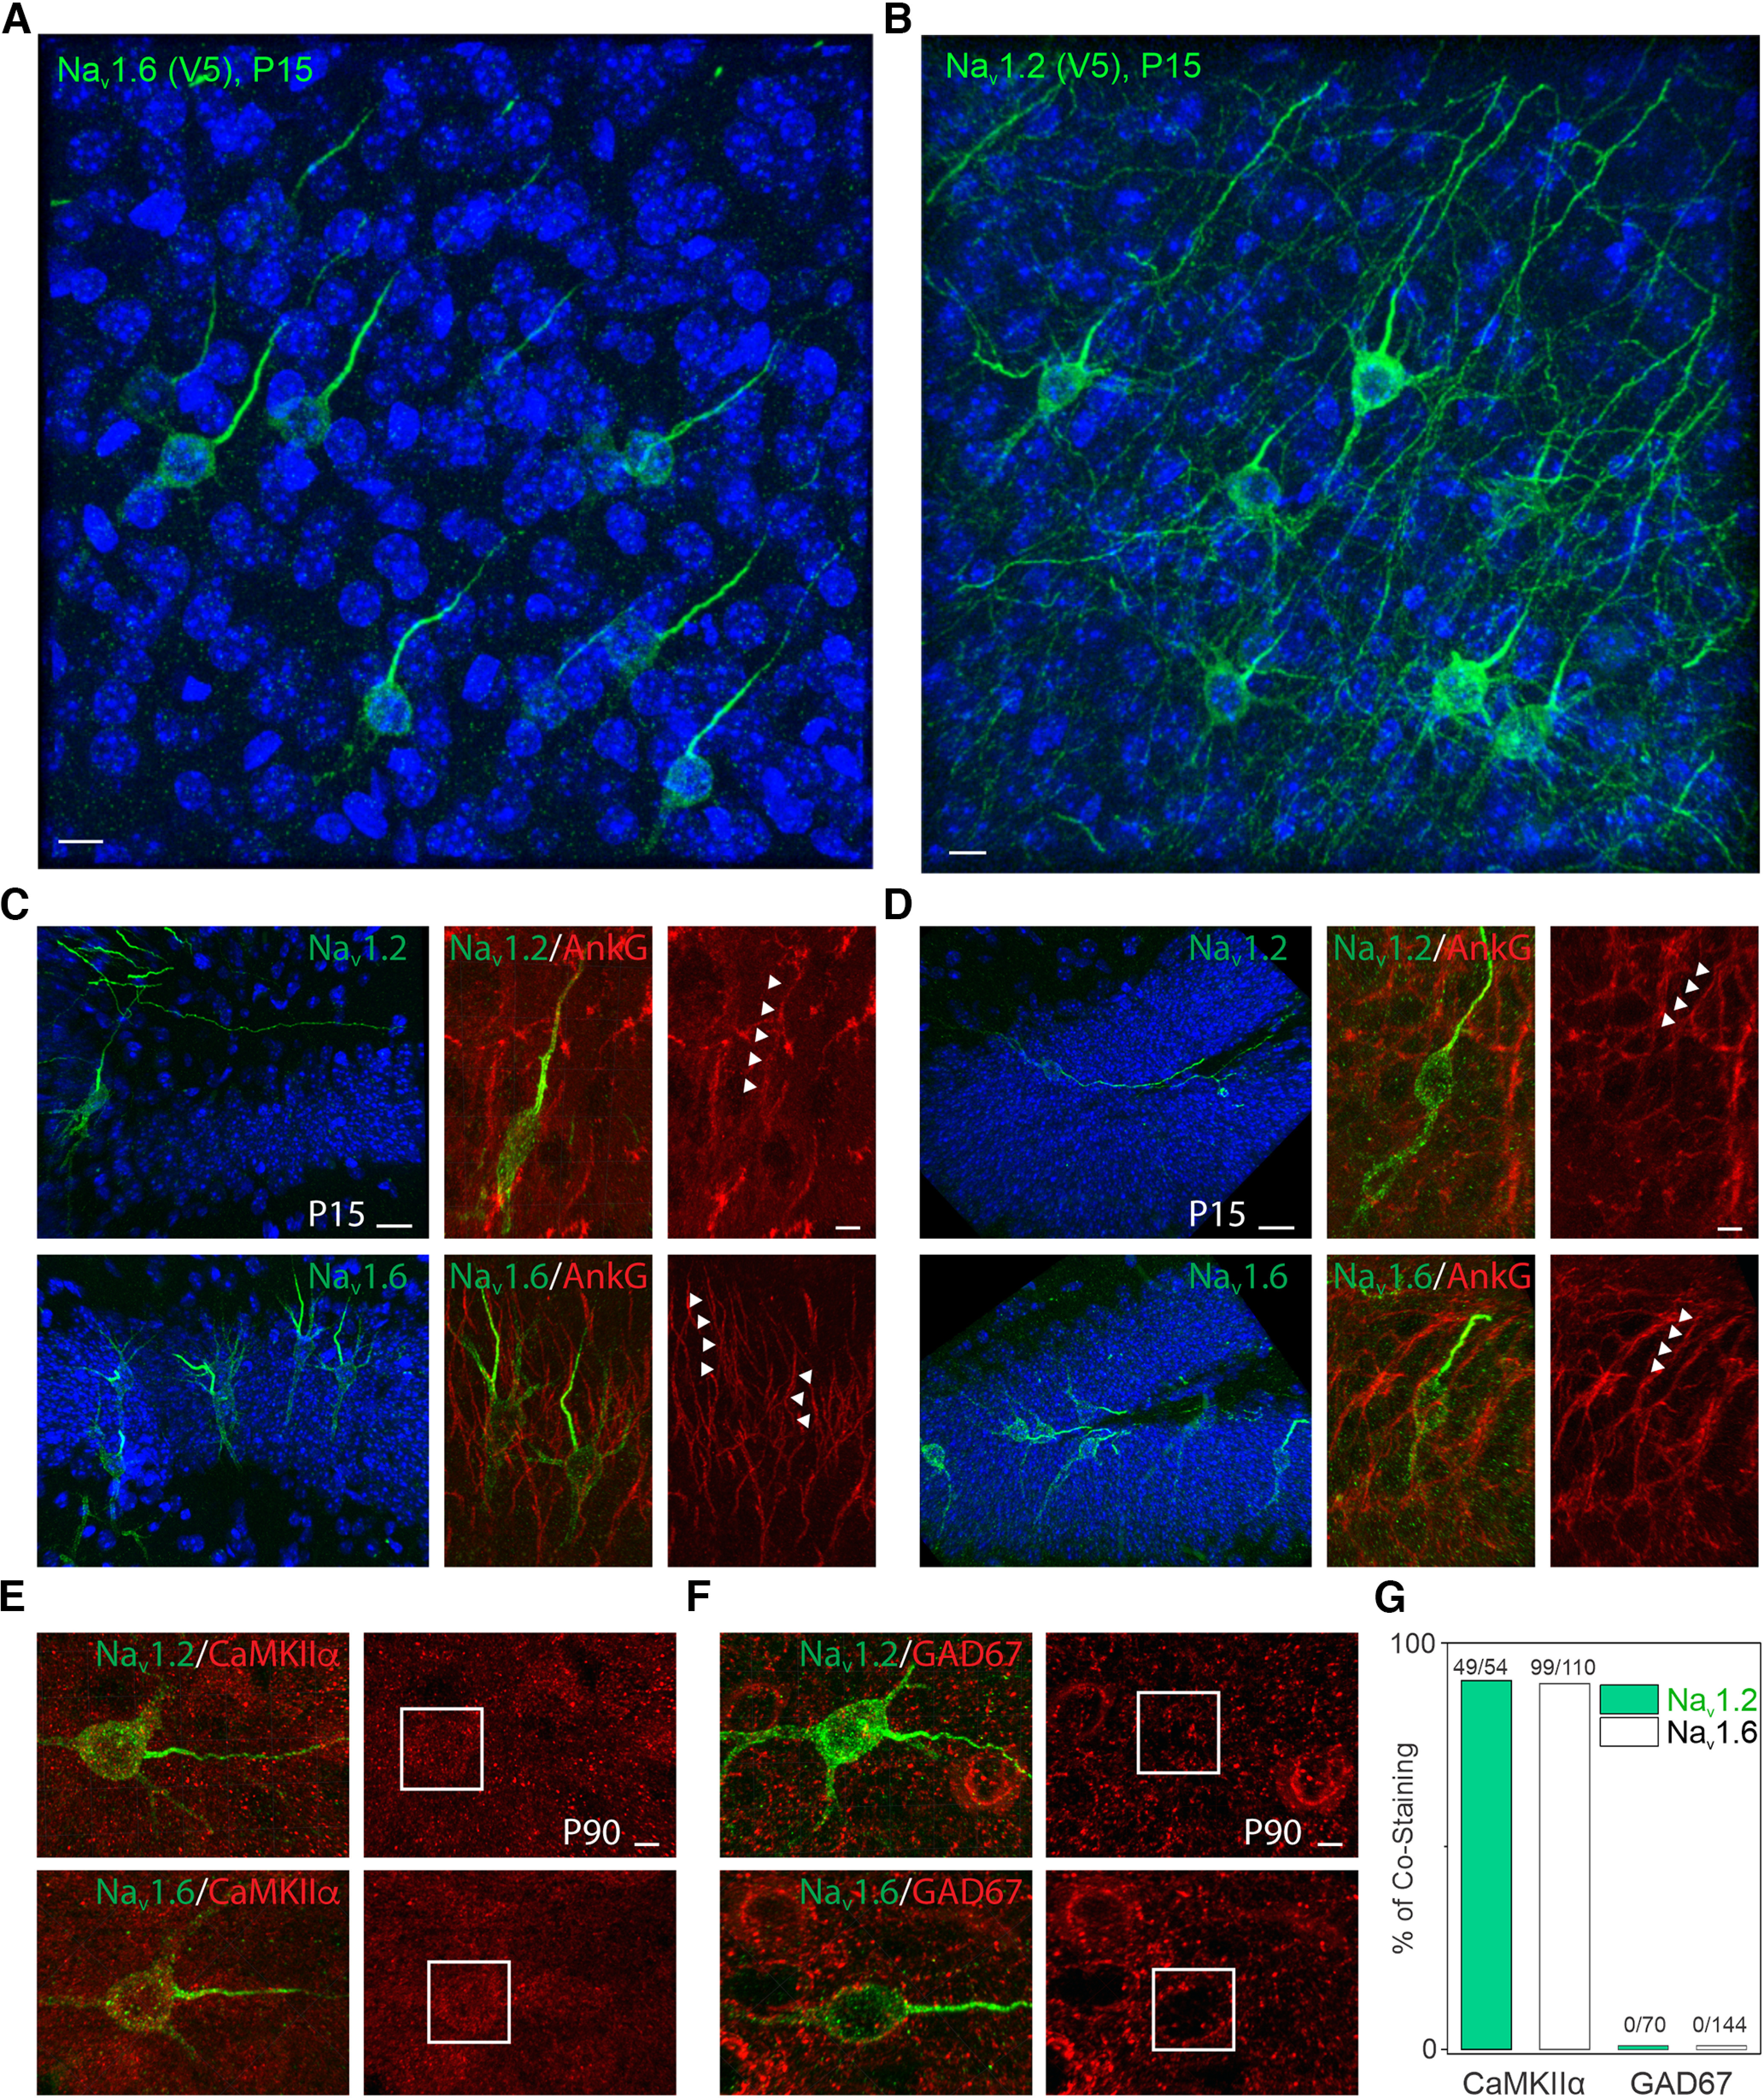
Differential subcellular distribution and cell-type-specific expression of Nav1.2 and Nav1.6 in the mouse brain. A, B, Representative images of Nav1.6 (A) and Nav1.2 (B) labeled with V5 tag in the cortex. Blue channel shows the Hoechst stain. Scale bar, 10 µm. C, D, Representative images of Nav1.2 and Nav1.6 labeled with V5 tag in CA1 (C) and dentate gyrus (D) of the hippocampus. Left, Blue channel shows the Hoechst stain. Scale bar, 20 µm. Right, Zoomed-in images costained with AnkG. Arrowheads indicate Nav1.2 or Nav1.6-positive region with AnkG signals. Scale bar, 5 µm. E, F, Double-immunofluorescence staining of V5-labeled Nav1.2 or Nav1.6 with CaMKIIα (E) or GAD67 (F) in the mouse cortex. Rectangles highlight the soma regions of Nav1.2 or Nav1.6-positive neurons. Scale bar, 5 µm. G, The positive ratio of Nav1.2 or Nav1.6 knock-in cells in CaMKIIα-positive excitatory or GAD67-positive inhibitory neurons.
