Figure 8.

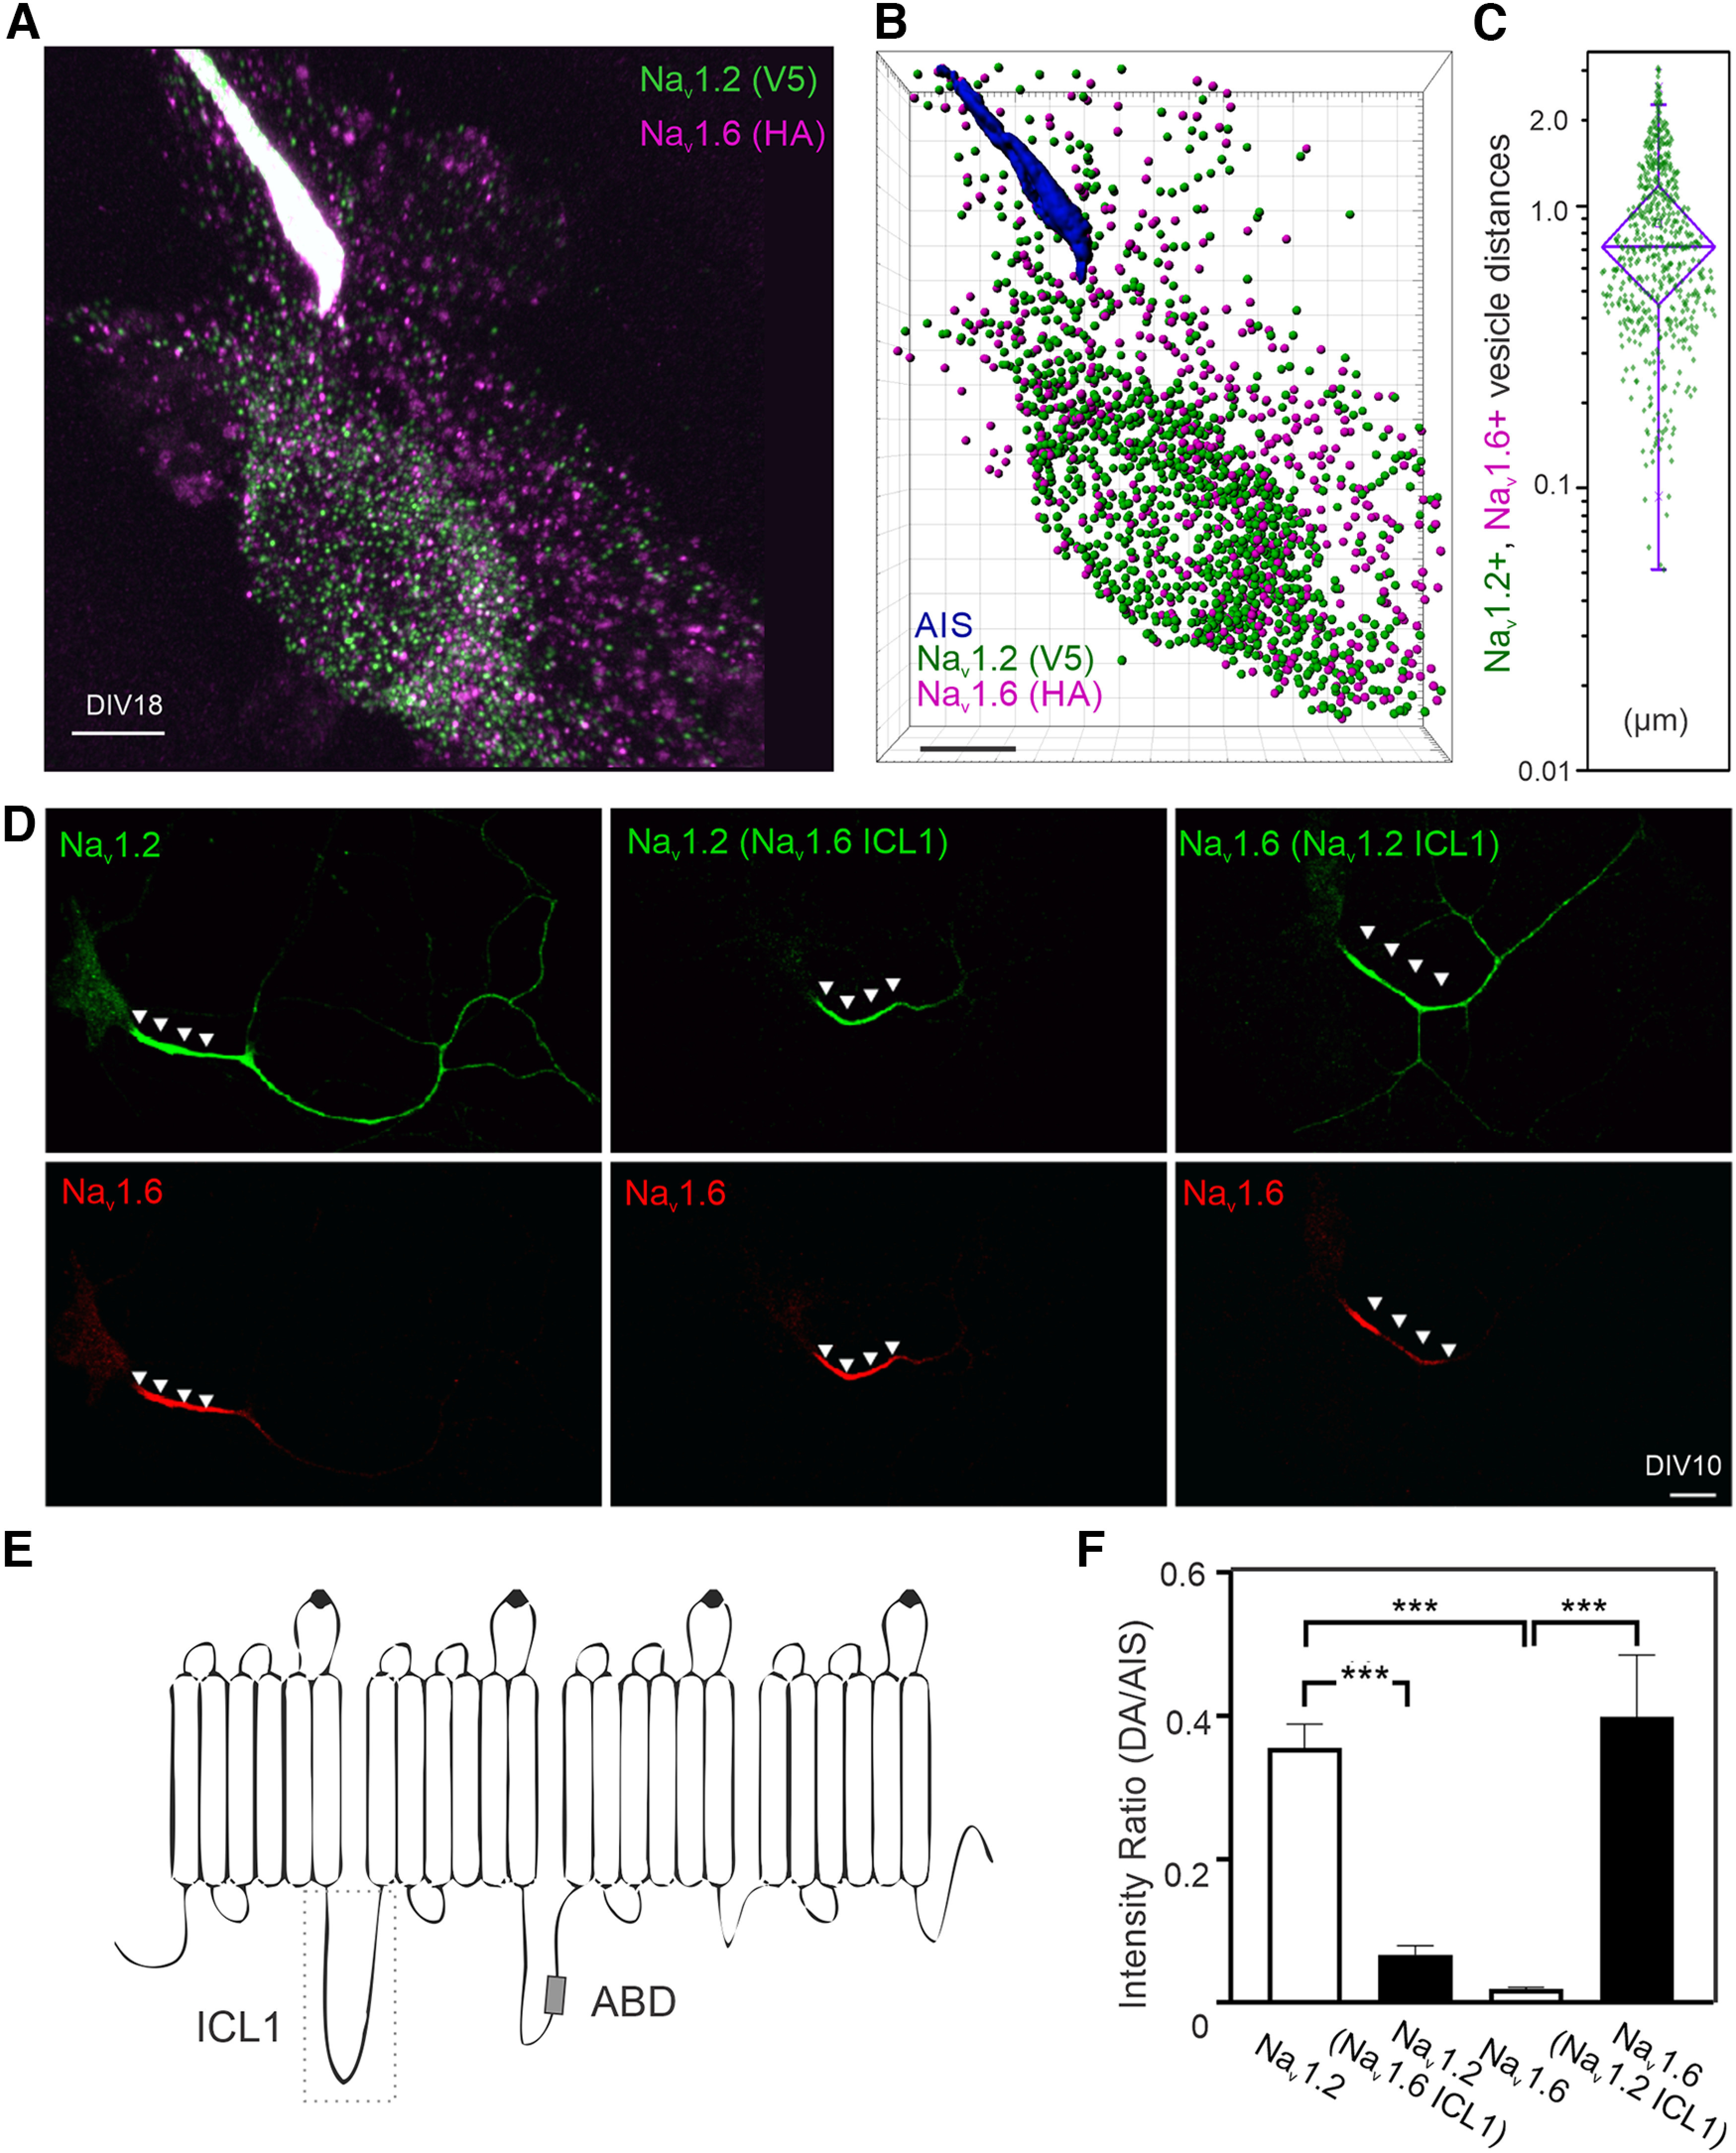
Compartment-specific targeting mechanisms for Nav1.2 and Nav1.6. A, Airyscan imaging of Nav1.2- and Nav1.6-positive vesicles in the same neuron. Movie 5 shows 3D image details. B, Computer-aided segmentation of Nav1.2 and Nav1.6 vesicles. Scale bar, 5 µm. C, The distribution of physical distances between Nav1.2- and Nav1.6-positive vesicle populations. In the box chart, top and bottom error bars represent the 95th and 5th percentiles, respectively; triangle represents the range from the 25th to 75th percentile; center line represents the median. D, The distribution patterns of exogenously expressed Nav1.2 and Nav1.6 in culture hippocampal neurons. Left, Localization patterns of wild-type Nav1.2 (green, V5) and Nav1.6 (red, HA). Middle, Nav1.2 with Nav1.6 ICL1 showed minimal enrichment at the distal axon. Right, Nav1.6 with Nav1.2 ICL1 gained access to the distal axon. Arrowheads indicate the AIS region. Scale bar, 20 µm. E, Rectangle region with dashed lines shows the ICL1 region of Nav1.2 and Nav1.6. ABD is indicated by a small gray rectangle. F, Nav1.2 with Nav1.6 ICL1 showed dramatic less enrichment in the distal axon. Conversely, Nav1.6 with Nav1.2 ICL1 gains the ability to localize to the distal axon. Error bars represent SEM. Nav1.2, n = 10 versus Nav1.2(Nav1.6 ICL1), n = 8, p = 0.0005; Nav1.2 versus Nav1.6, p < 0.0001; Nav1.6, n = 10 versus Nav1.6(Nav1.2 ICL1), n = 13, p < 0.0001.
