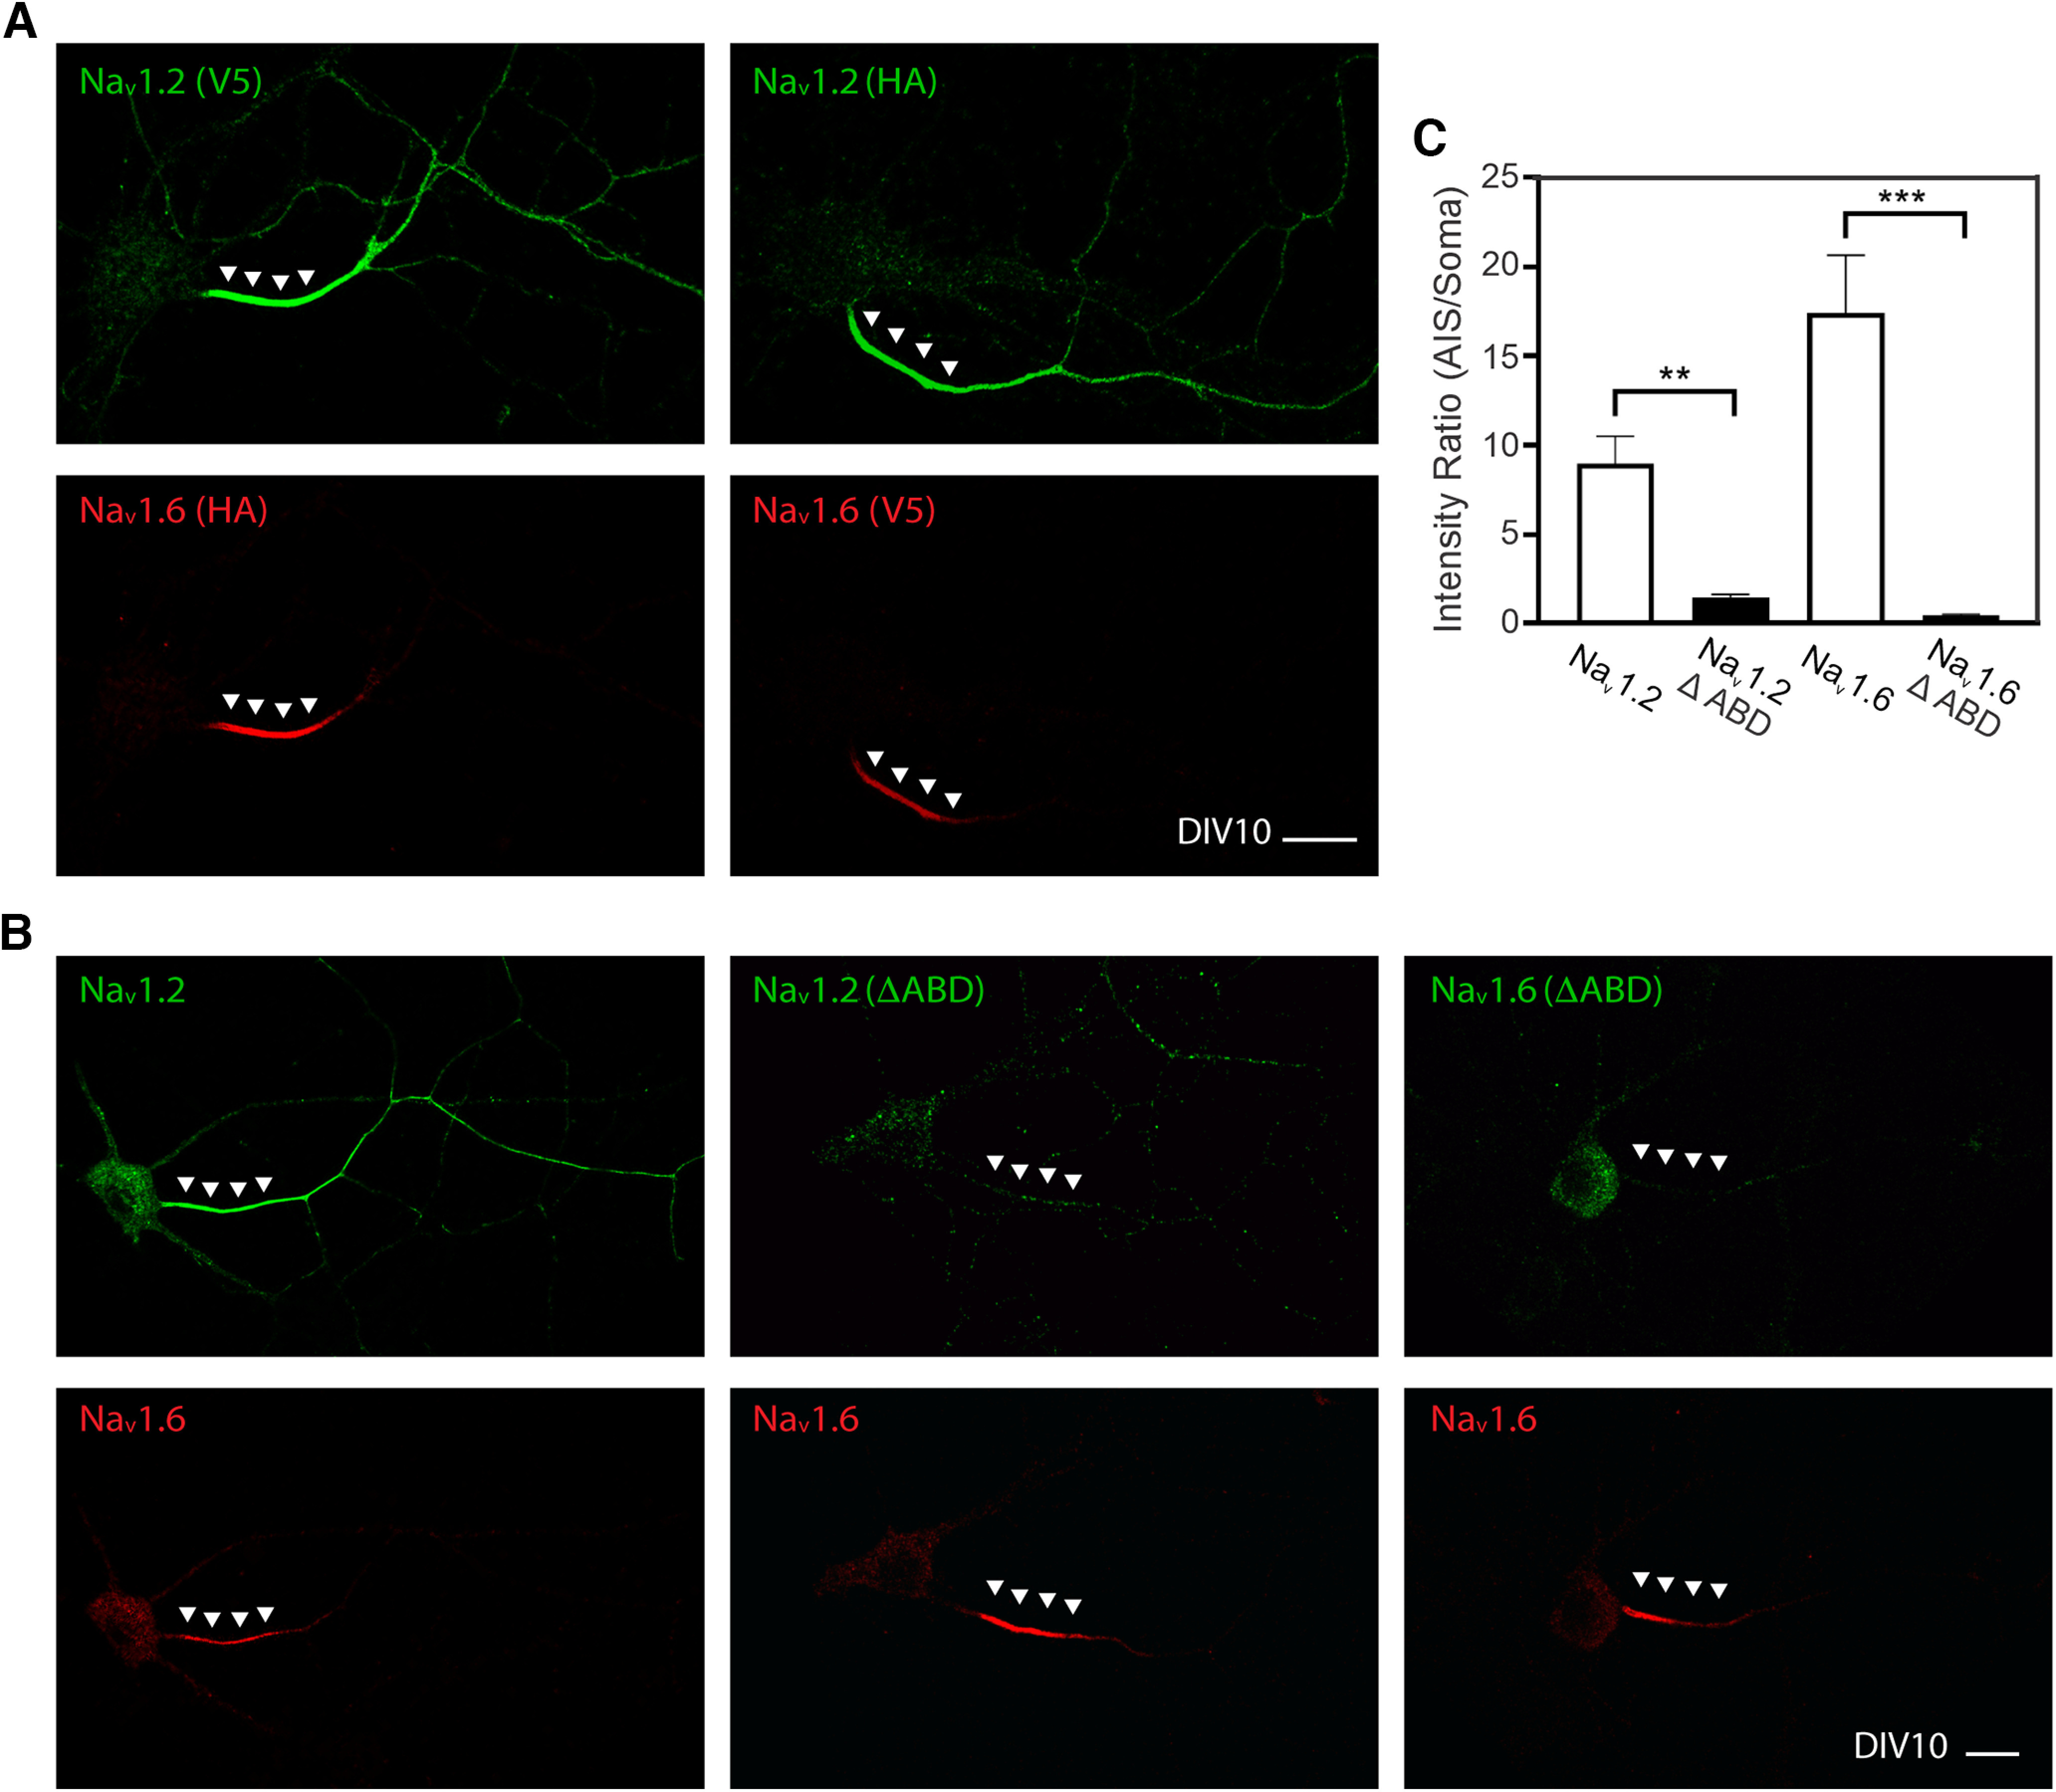
Figure 9.

ABD deletion greatly reduced Nav1.2 and Nav1.6 levels in the AIS. A, Switching V5 and HA tags to label Nav1.2 and Nav1.6 didn't affect their subcellular distribution patterns. B, After ABD deletion, Nav1.2 and Nav1.6 localizations in the AIS are dramatically decreased. Green, V5; red, HA. Arrowheads in A and B indicate the AIS region. Scale bars, A, B, 20 µm. C, Deletion of ABD abolished enrichment of Nav1.2 and Nav1.6 in AIS. Error bars represent SEM. Nav1.2, n = 10 versus Nav1.2(ΔABD), n = 13, p = 0.0049; Nav1.6, n = 10 versus Nav1.6(ΔABD), n = 17, p < 0.0001.
