
Figure 5.
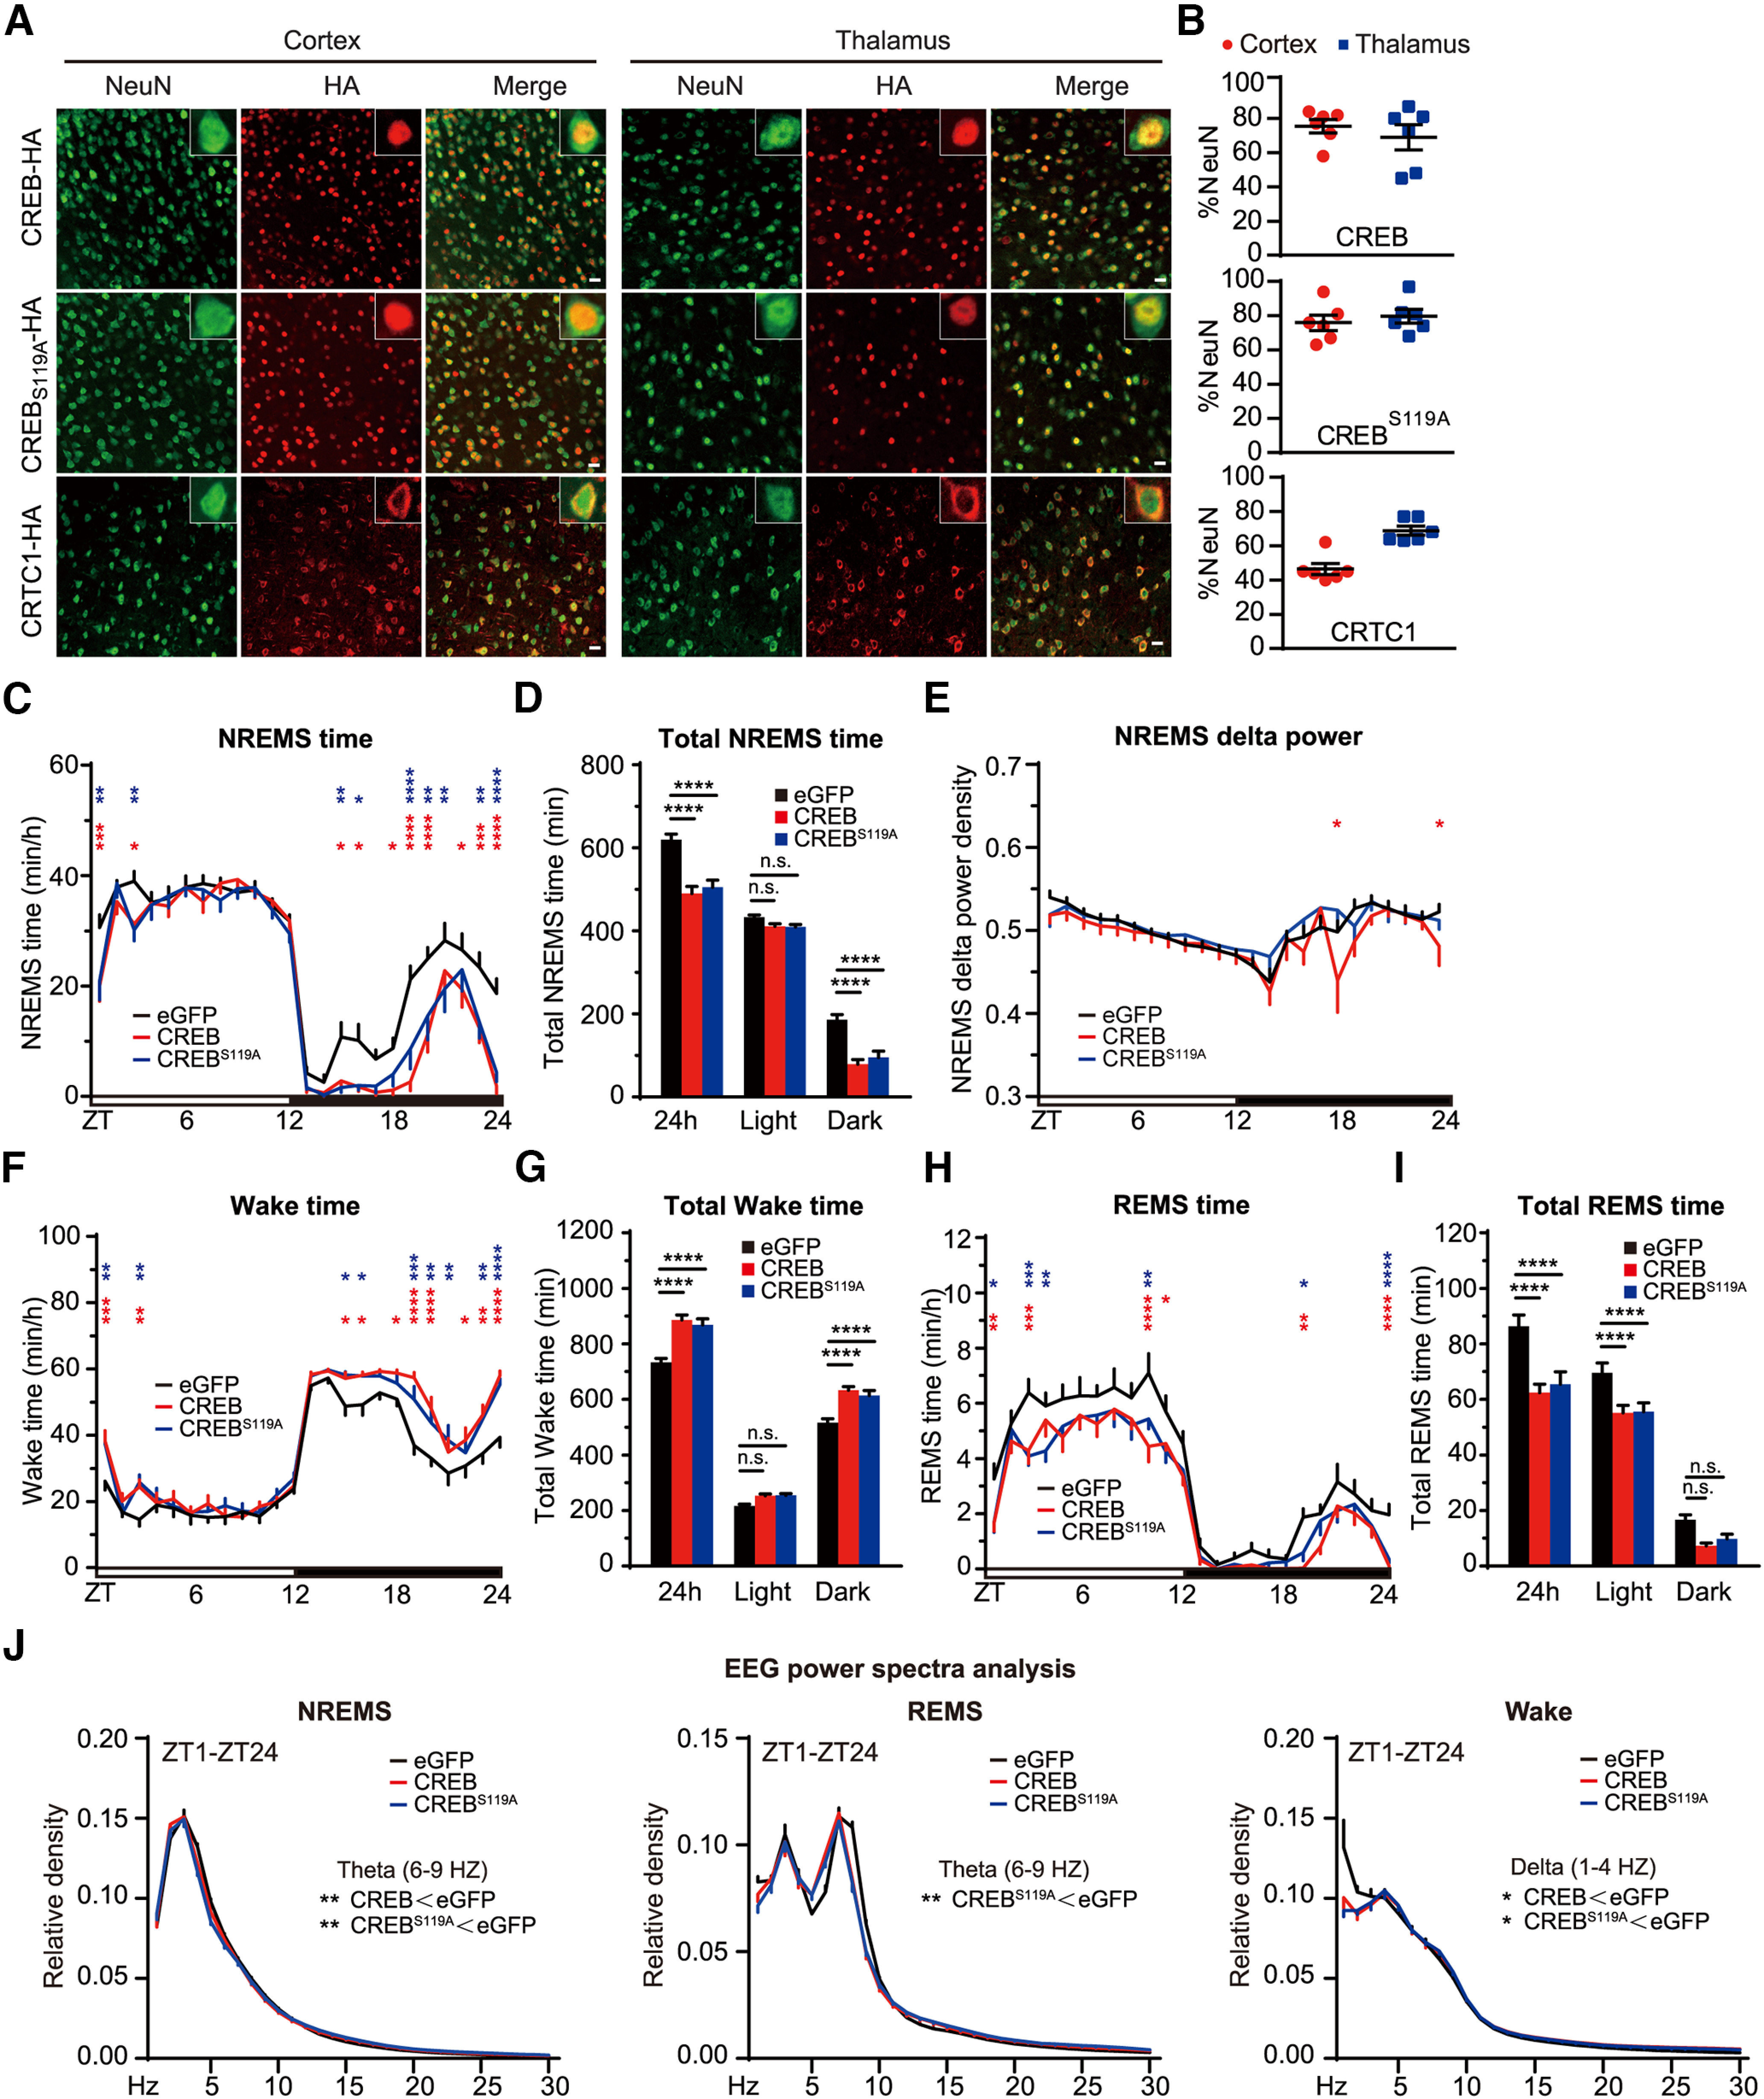
ABC-expression of CREB reduces NREMS amount and δ power. A, Coimmunostaining of HA+ (red) and NeuN+ (green) neurons in the cortex and thalamus of AAV-hSyn-CREB (ABC-CREB), AAV-hSyn-CREBS119A (ABC-CREBS119A), and AAV-hSyn-CRTC1 (ABC-CRTC1)-injected mice. B, Quantification of the viral transduction rates, which is calculated by the percentage of NeuN+ neurons that express HA-tagged proteins, in the cortical and thalamic neurons of ABC-CREB, ABC-CREBS119A, and ABC-CRTC1 mice. C–E, Hourly plot of NREMS time (C), quantification of total NREMS time (D), and hourly plot of NREMS δ power (E) in the ABC-eGFP (n = 11), ABC-CREB (n = 12), and ABC-CREBS119A (n = 11) mice. Shown above are the statistical analysis for comparison between ABC-CREB (red*) or ABC-CREBS119A (blue*) mice and control ABC-eGFP mice. F–J, Hourly plots of Wake (F) or REMS (H) time, quantification of total Wake (G) or REMS (I) time, and EEG power spectra analysis of NREMS, REMS, and Wake states (J) in the ABC-eGFP (n = 11), ABC-CREBΔ (n = 12), and ABC-CREBΔS119A (n = 11) mice. Shown above is statistical analysis for comparison between ABC-CREB (red*) or ABC-CREBS119A (blue*) mice and control ABC-eGFP mice. Data are mean ± SEM. C–J, Two-way ANOVA with Dunn's multiple comparisons test. *p < 0.05; **p < 0.01; ***p < 0.001; ****p < 0.0001.