
Fig. 1 |. Expression of the BRAFV600E mutation in mouse and human multipotent HPCs is sufficient to lead to LCH lesions.
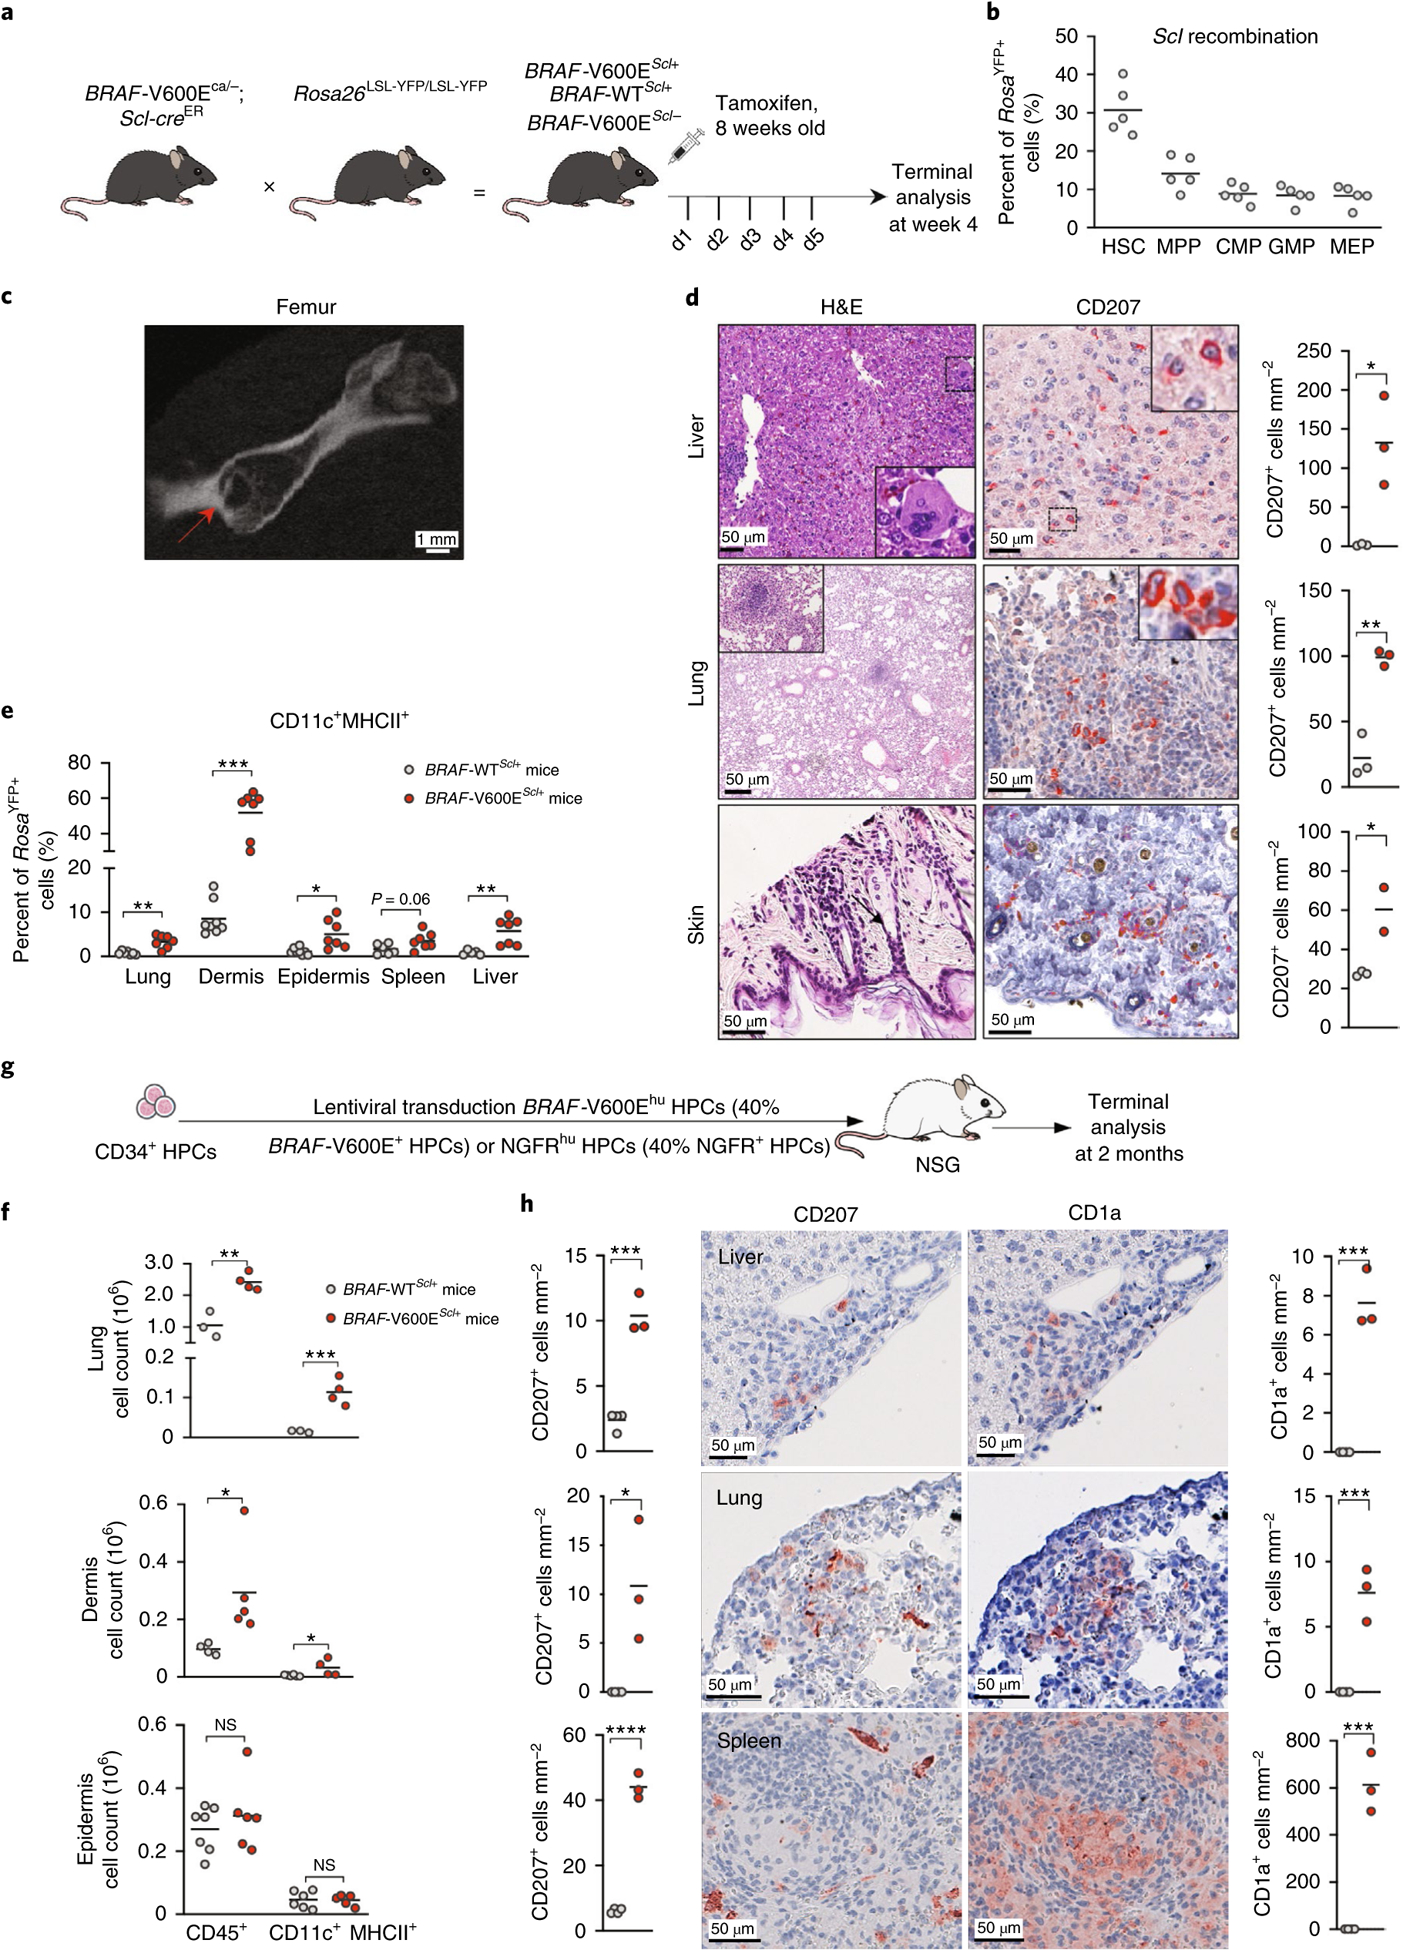
a, Cartoon shows the experimental breeding scheme used to generate BRAF-V600EScl+ mice and control littermates. d1–5 indicates day 1–5. b, Percentage of RosaYFP+ cells among purified hematopoietic progenitors in BRAF-WTScl+ mice 4 weeks after tamoxifen injections (n = 5 mice). CMP, common myeloid progenitor; MEP, megakaryocytic erythroid progenitor. c, Representative computerized tomography image of a femur from a BRAF-V600EScl+ animal. The red arrow shows a pathognomonic granuloma. d, H&E staining and CD207 immunohistochemistry staining of tissues isolated from BRAF-V600EScl+ mice. We note the presence of multinucleated giant cells and granuloma-like lesions. The graph represents the number of CD207+ cells per mm2 in tissue sections isolated from animals (n = 3 mice per group). e, Percentage of the CD11c+MHCII+ MNP population among RosaYFP+ cells in organs of BRAF-V600EScl+ mice and control littermates. Data are representative of three experiments (n = 7 mice). f, Absolute numbers of total CD45+ immune cells and CD11c+MHCII+ MNPs that populate the lung and the skin of BRAF-V600EScl+ mice and control littermates. Data are representative of three experiments (n = 3–7 mice). NS, not significant. g, Cartoon shows the scheme used to generate the humanized LCH mouse. h, Liver, lung and spleen tissue sections isolated from humanized mice reconstituted with BRAF-V600Ehu HPCs were stained with anti-CD207 and anti-CD1a antibodies. Graphs represent the number of CD207+ or CD1a+ cells per mm2 in tissue sections isolated from animals (n = 3–4 mice). Data are represented as mean ± s.e.m.; statistical significance was analyzed by unpaired two-sided t-tests and is indicated by *P < 0.05, **P < 0.01, ***P < 0.001 and ****P < 0.0001. These data are representative of three independent experiments.