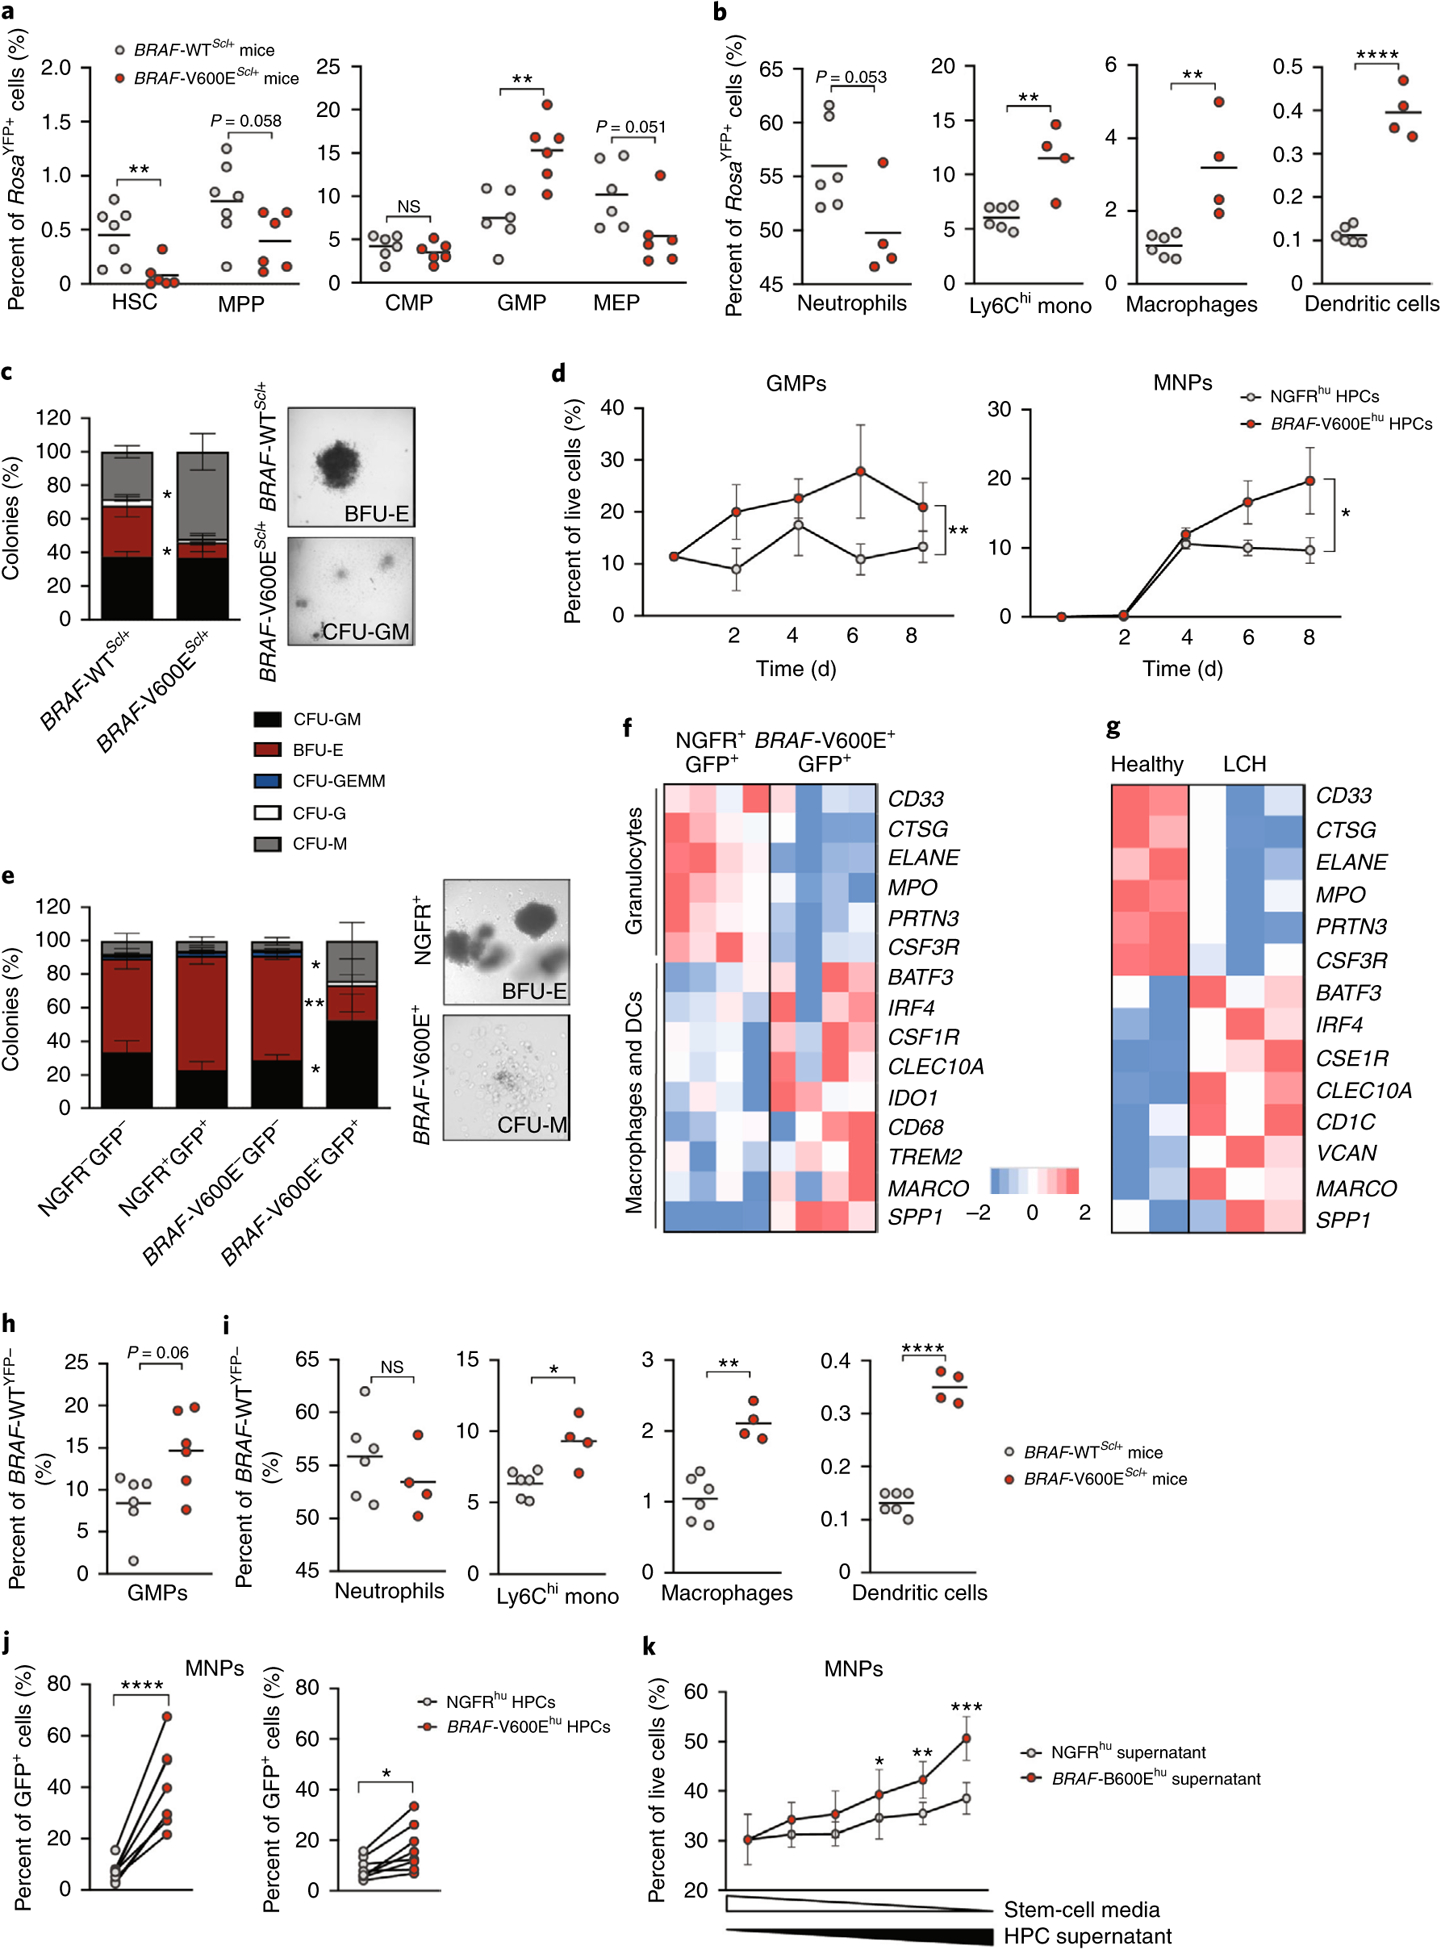
Fig. 2 |. Expression of the BRAFV600E mutation in multipotent hematopoietic progenitors enforces their differentiation toward the MNP lineage.

a–c, BRAF-V600EScl+ mice were generated as described in Fig. 1a, and, in these mice, RosaYFP+ cells mark BRAF-V600E+ cells, while RosaYFP− cells mark BRAF-V600E− cells. In BRAF-WTScl+ control littermates, RosaYFP+ cells mark those that underwent a Cre recombination as well. a, Graphs show the percentage of HSCs, MPPs, common myeloid progenitors, granulocytic myeloid progenitors and megakaryocytic erythroid progenitors among RosaYFP+ cells in the BM of BRAF-V600EScl+ mice and BRAF-WTScl+ control littermates (n = 6–7 mice). b, Percentages of neutrophils, Ly6Chi monocytes (mono), macrophages and dendritic cells among RosaYFP+ cells in the BM of BRAF-V600EScl+ mice and BRAF-WTScl+ control littermates (n = 4–6 mice). c, CFU assays were performed on purified lineage-negative BM cells isolated from BRAF-V600EScl+ mice or BRAF-WTScl+ control littermates (n = 3 mice) cultured in the presence of methylcellulose, with representative phase contrast photomicrographs of colonies. GEMM, granulocytes, erythrocytes, megakaryocytes, monocytes, megakaryocytes. d–f, Purified CD34+ HPCs transduced with BRAFV600E (BRAF-V600Ehu) or NGFR control (NGFRhu) lentiviral vectors were cultured in stem cell medium for 8 d. d, Graphs show the percentages of GMPs (defined as CD34+CD38+CD10−CD123hi/intCD45RA+/−)34 and the percentages of MNPs (defined as CD66b−CD11c+MHCII+) among live cells (n = 3 donors). e, CFU assays in methylcellulose performed on purified BRAF-V600E−GFP− and BRAF-V600E+GFP+ cells isolated from HPCs transduced with the BRAFV600E lentiviral vector or purified NGFR+GFP+ or NGFR−GFP− cells isolated from HPCs transduced with the NGFR lentiviral vector as described in Extended Data Fig. 3 (n = 6 donors). Representative phase contrast photomicrographs of colonies are shown. f, Human CD34+ HPCs transduced with BRAFV600E or the control NGFR lentiviral vector were cultured for 7 d in stem cell medium and analyzed using microarray sequencing. Heatmap representation of genes involved in granulopoiesis and the macrophage–dendritic cell (DC) lineage is shown (n = 4 independent donors per group). g, Purified CD34+ BM cells were isolated from a healthy pediatric donor (in duplicate) and from three patients with LCH and BM mononuclear cells known to be BRAF-V600E+, and these cells were analyzed using bulk RNA-seq. Heatmap representation of genes involved in granulopoiesis and the macrophage–dendritic cell lineage is shown. h,i, BRAF-V600EScl+ mice and BRAF-WTScl+ control littermates were generated as described in Fig. 1a. The percentages of GMPs (h), neutrophils, Ly6Chi monocytes, macrophages and dendritic cells (i) among BRAFWT;RosaYFP− cells in the BM of BRAF-V600EScl+ mice and BRAF-WTScl+ control littermates is shown. j, Human CD34+ HPCs were transduced with BRAFV600E or NGFR lentiviral constructs and cultured in stem cell medium. Seven days later, the percentages of CD11c+ and/or CD14+ MNP cells among BRAFV600E (GFP+) or BRAFWT (GFP−) cells were measured by flow cytometry. Because the transduction efficiency was around 40% for both vectors, GFP+ cells mark BRAF-V600E+ or NGFR+ cells, while GFP− cells mark BRAFWT or NGFR− cells among HPCs transduced with the BRAFV600E or NGFR lentiviral construct, respectively (n = 8 independent donors). k, Healthy human CD34+ cord blood HPCs were cultured in stem cell medium (concentration is represented by the white triangle) in addition to supernatant isolated from HPCs transduced with the BRAFV600E lentiviral construct or the NGFR control (concentration is represented by the black triangle). The graph shows the percentage of HPC differentiation into CD14+ MNPs analyzed by flow cytometry after 5 d of culture (n = 4 independent donors), analyzed by paired t-tests. Data are represented as mean ± s.e.m.; *P < 0.05, **P < 0.01, ***P < 0.001, ****P < 0.0001 (unpaired two-sided t-tests, two-way ANOVA test for d and paired two-sided t-tests for j,k). Data are representative of at least three independent experiments.
