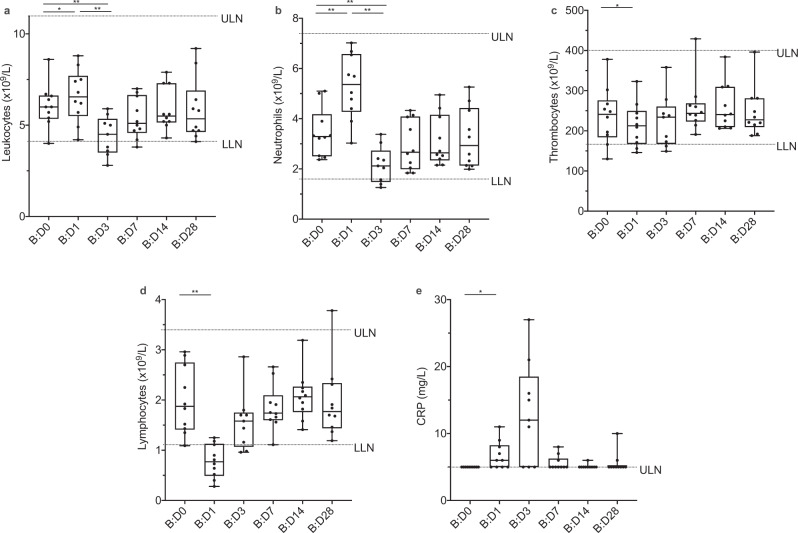
Fig. 2. Biologic monitoring.
Graphs represent changes in a leukocyte, b neutrophil, c thrombocyte, and d lymphocyte counts, as well as e C-reactive protein (CRP) levels, in all booster study participants (n = 10) after booster vaccination. We observed an increase in a leukocyte (p = 0.014) and, by extension, b neutrophil counts (p = 0.002) as well as e CRP levels (p = 0.031) and a decrease in c thrombocyte (p = 0.049) and d lymphocyte (p = 0.002) counts on boost (B) Day 1 (B:D1) compared to B:D0. By B:D3, leukocyte and neutrophil counts had decreased (p = 0.004 for both neutrophil and leukocyte count on B:D1 vs B:D3 and B:D0 vs. BD3). These changes from baseline were transient and not clinically significant, but indicate biologic activity after vaccination. CRP levels of <5 mg/L (below the limit of detection) were set to 5 mg/L for visualization. Boxes indicate 25–75 percentile; whiskers are min. to max.; medians are shown as horizonal lines within the boxes. ULN = upper limit of normal. LLN = lower limit of normal. *p < 0.05, **p < 0.005, differences assessed using a two-sided Wilcoxon matched-pairs signed rank test. Source data are provided as a Source Data file.

