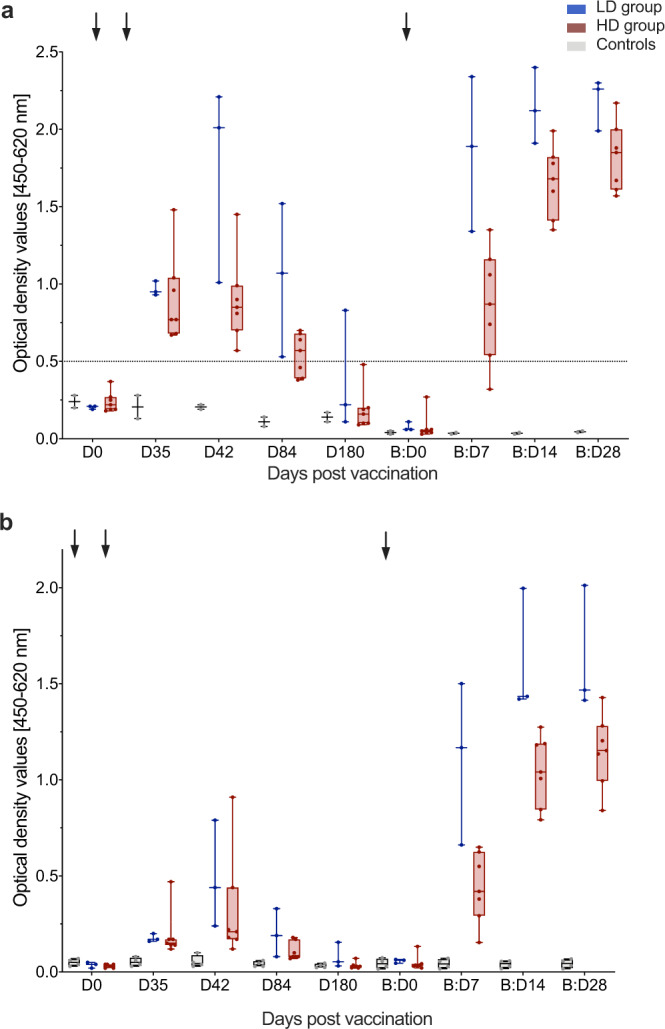
Fig. 3. Increase in anti-MERS-CoV-S-specific binding antibodies after booster vaccination.

Anti-MERS-CoV-S-specific binding antibodies were measured as optical density values (y-axes) by two distinct ELISAs a in-house ELISA, b EUROIMMUN ELISA) at multiple timepoints after first (Day (D) 0 (D0), D35, D42, D84, D180) and booster (B) (B:D0, B:D7, B:D14, B:D28) vaccinations (x-axes). Former low dose (LD, n = 3) and high dose (HD, n = 7) vaccinees are depicted in blue and red, respectively, controls in gray (n = 2 in (a) and n = 4 in (b)). Boxes indicate 25–75 percentile; whiskers are min. to max.; medians are shown as horizonal lines within the boxes. Arrows indicate vaccinations. The horizontal dashed line in (a) indicates the cut-off level for positivity. Source data are provided as a Source Data file.
