
Figure 2. SKAP decreases tension at the kinetochore-microtubule interface.
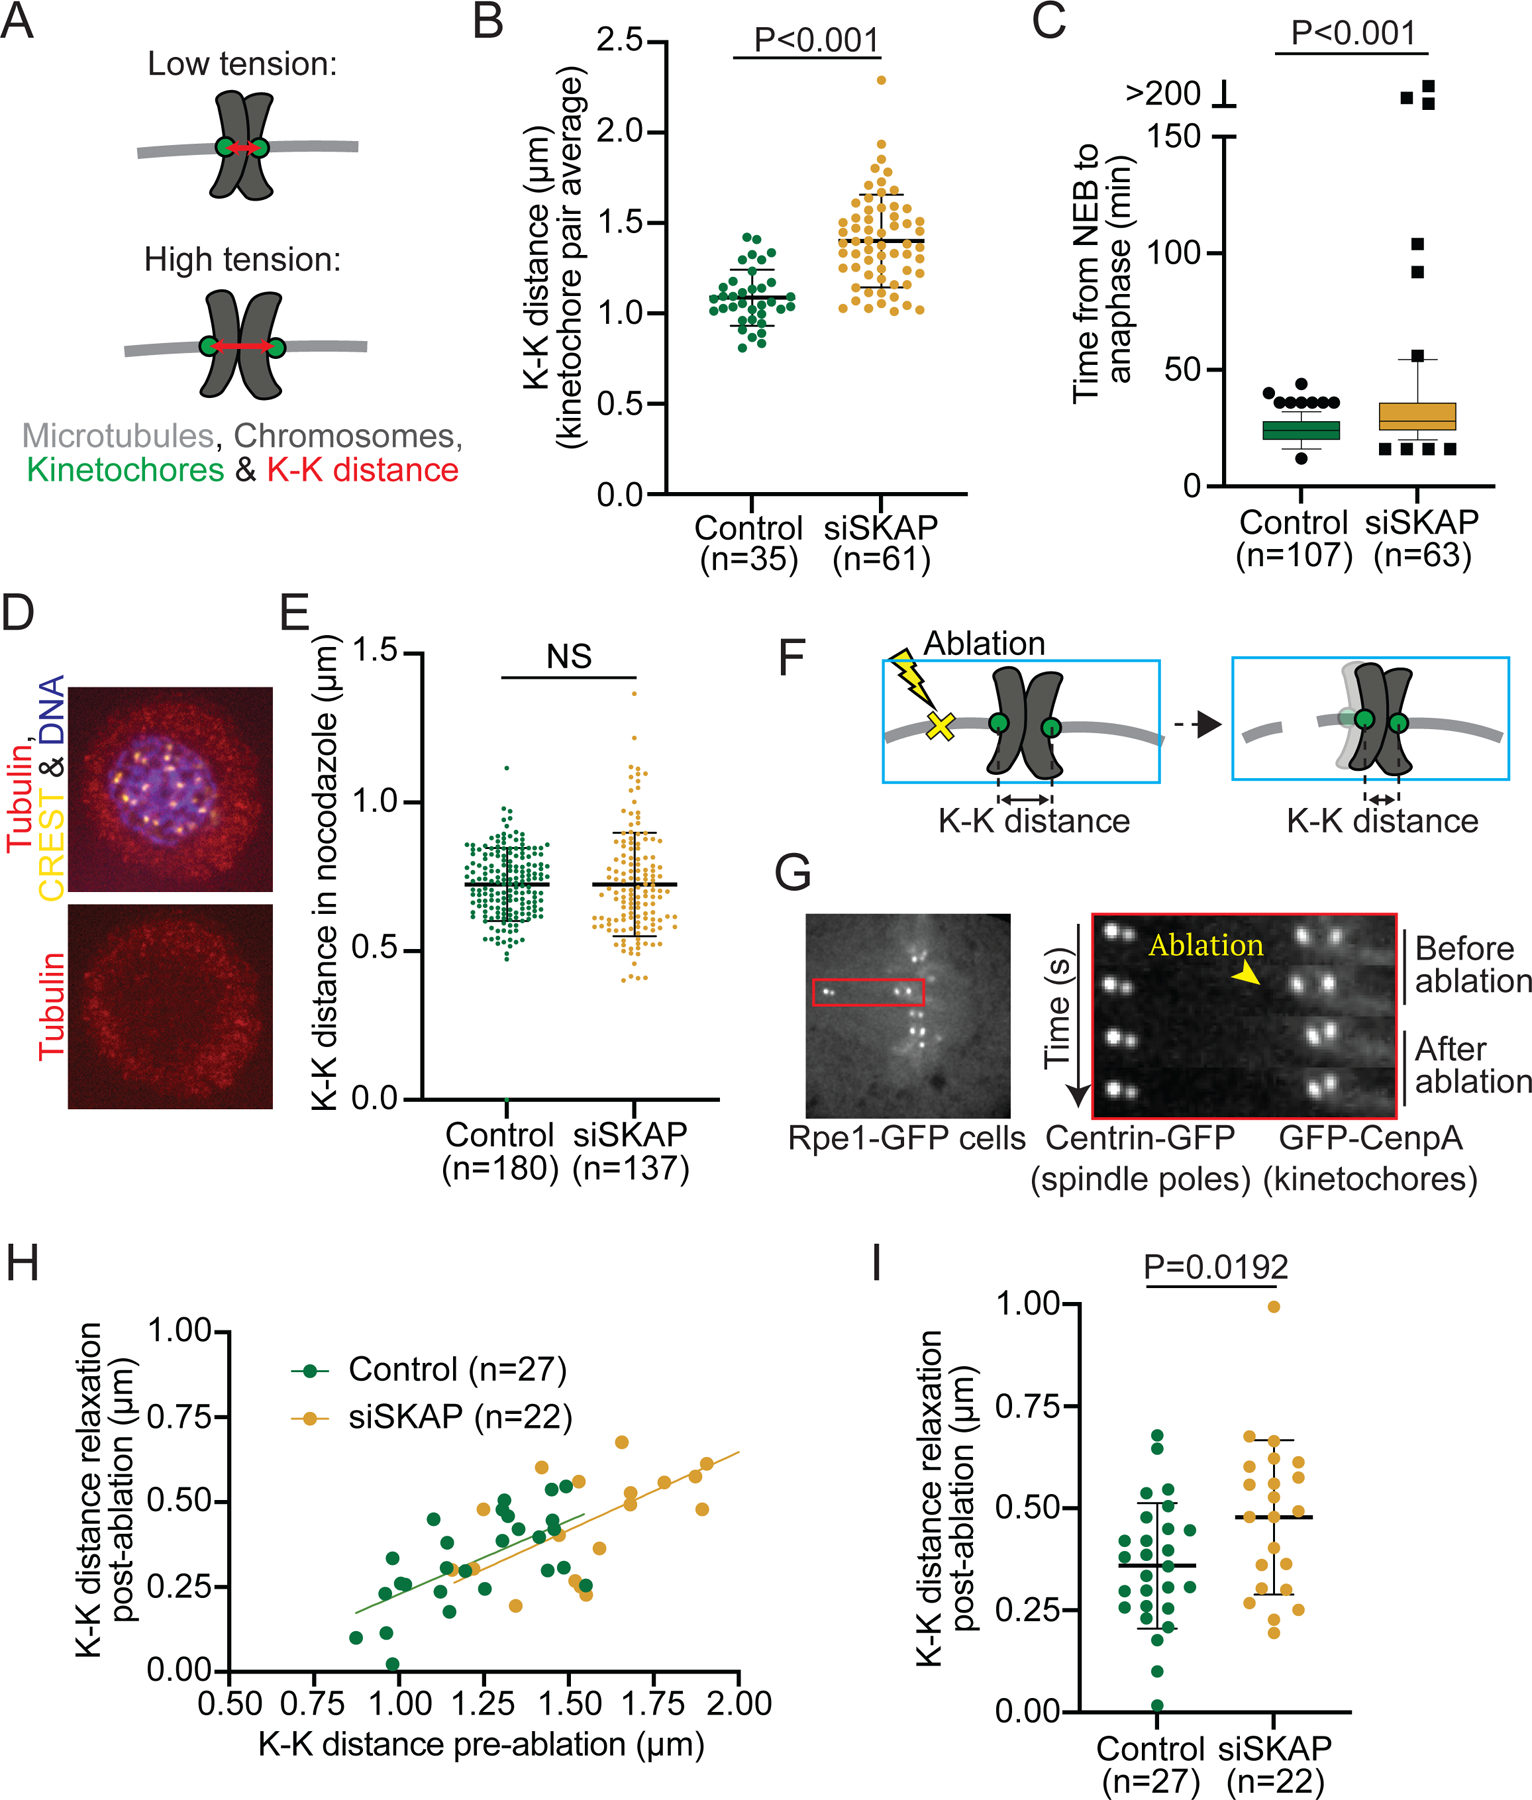
(A) High tension between sister kinetochores leads to a high K-K distance (red double arrow). High tension can stem from high spindles forces, a tighter grip of kinetochores on spindle microtubules, or both. (B) K-K distance average over time for individual kinetochore pairs in control and siSKAP Rpe1-GFP cells from the dataset in Figure 1 (studentś t-test) (n=number of kinetochore pairs, 1–4 kinetochore pairs per analyzed cell from 18 control and 20 siSKAP cells). (C) Time that individual control or siSKAP cells spend from nuclear envelope breakdown (NEB) to anaphase onset (Mann-Whitney test) (n=number of cells). Box and whiskers graph (quartiles including 5–95%) (D) Representative immunofluorescence images in control and siSKAP nocodazolde treated Rpe1-GFP cells (2µM nocodazole, 3 h) stained for CREST (yellow), chromosomes (purple) and tubulin (red). (E) K-K distance for individual sister pairs in control and siSKAP cells treated with nocodazole (Mann-Whitney test) (n=number of kinetochore pairs). (F-G) Laser ablation (yellow X) of k-fiber near a kinetochore releases tension, if present, across a sister pair (schematic cartoon) (F), as shown in representative kymograph images of K-K distance relaxation upon k-fiber ablation (yellow arrowhead) in Rpe1-GFP cells (G). (H-I) K-K distance relaxation (decrease) post-ablation as a function of K-K distance pre-ablation (linear regression lines for each condition) (H) or as a direct comparison (I) (studentś t-test) in control vs siSKAP cells (n=number of ablations, one ablation per cell). See also Figure S2.