
Figure 4. SKAP increases k-fiber depolymerization velocity and kinetochore force-responsiveness.
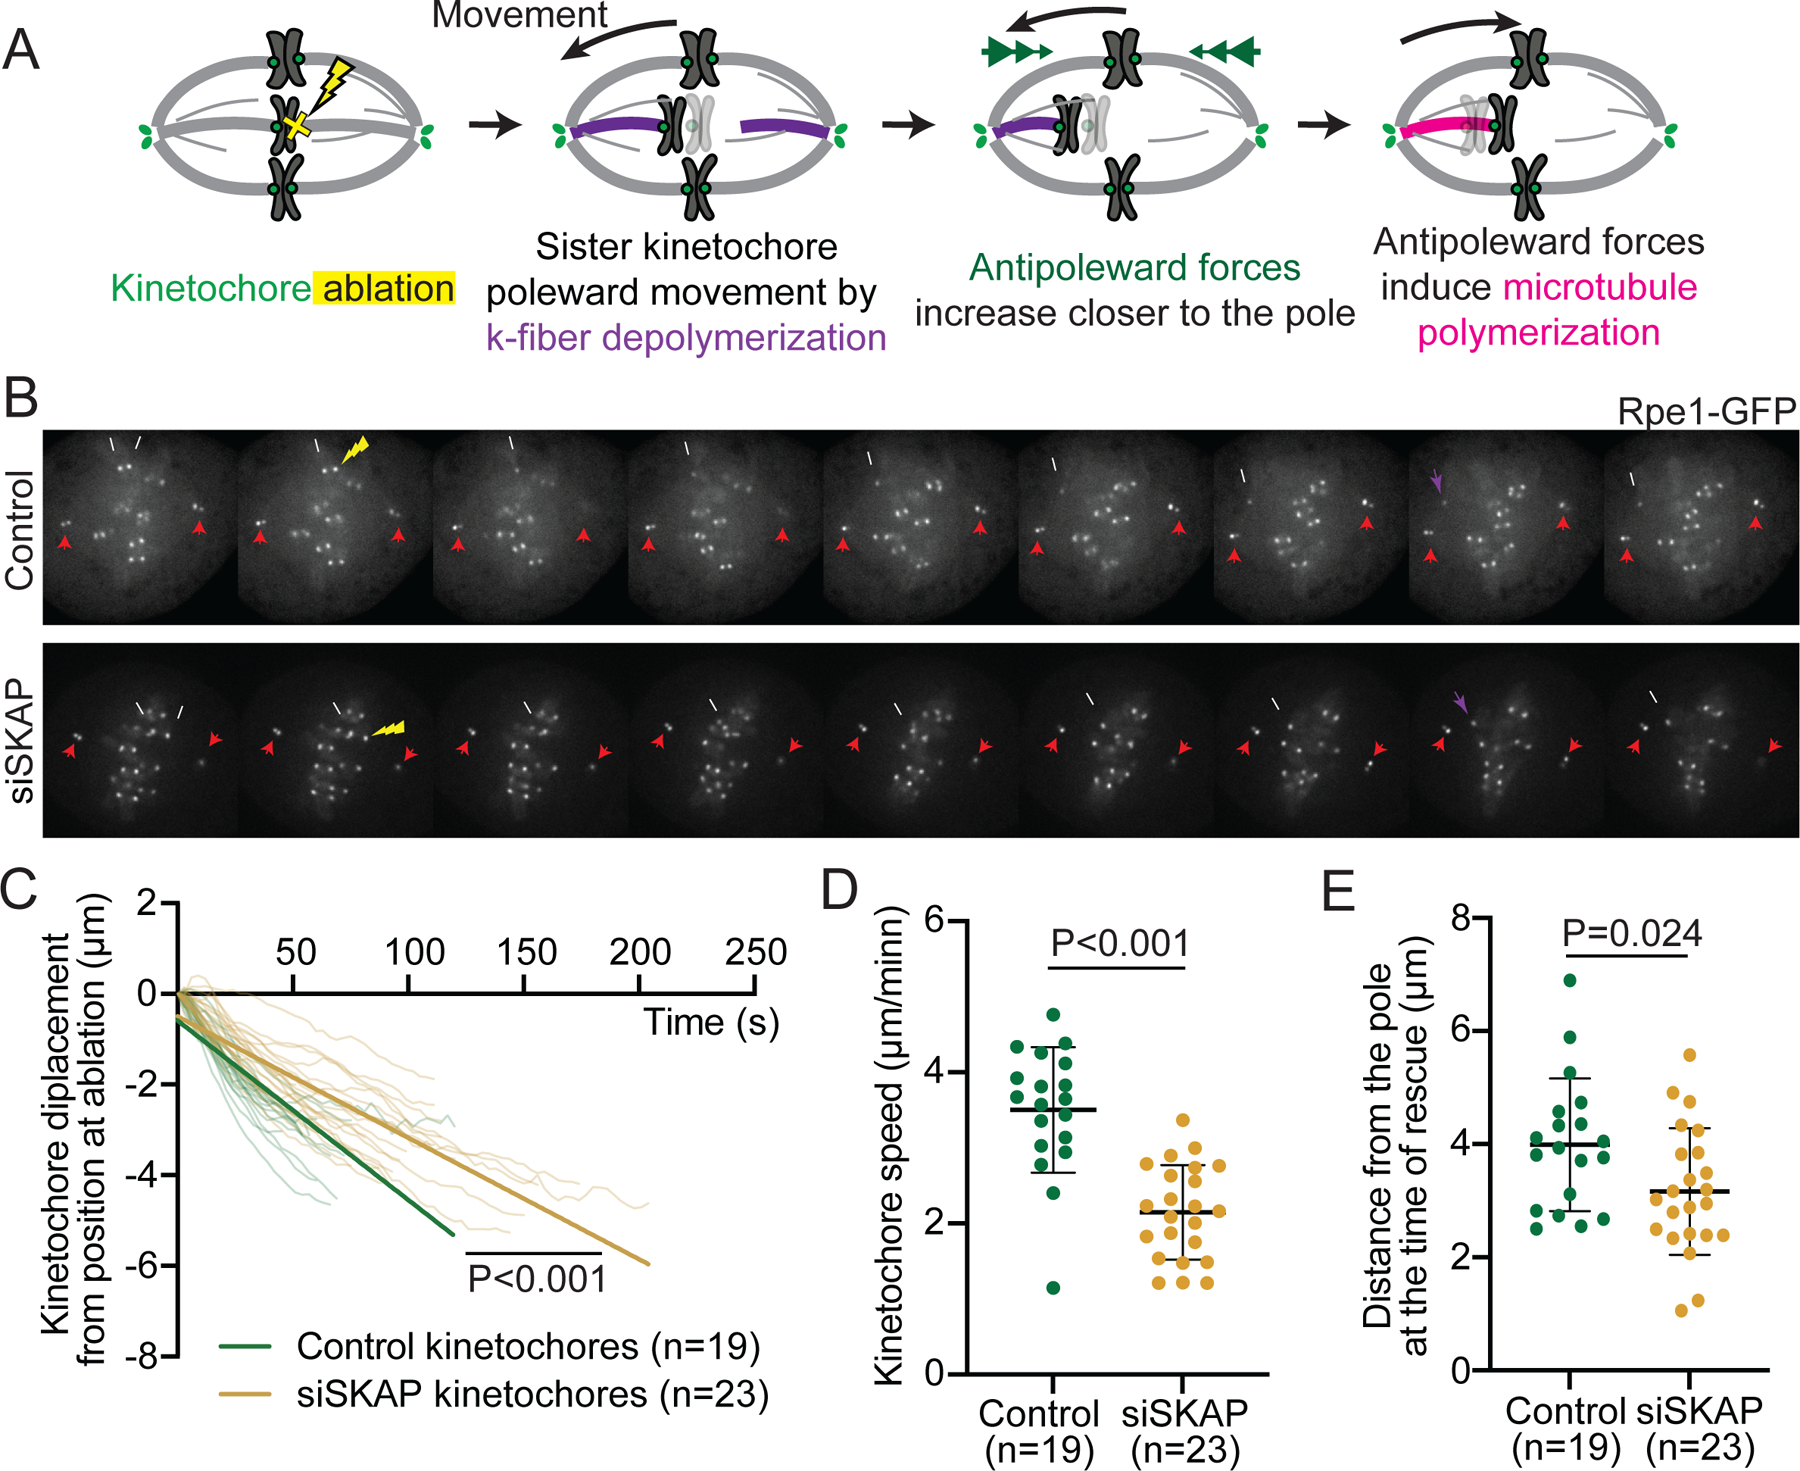
(A) Kinetochore ablation assay to isolate kinetochores associated to depolymerizing microtubules: laser ablation (yellow X) of one sister leads to the other sister moving poleward as its microtubules depolymerize (purple), and to later move away-from-the pole as polar ejection forces (green arrowheads) increase and microtubules rescue and polymerize (pink). (B) Representative time lapse images of kinetochore ablation (yellow arrow) in control (top) and siSKAP (bottom) Rpe1-GFP cells, with remaining sister kinetochore (white arrow) and centrioles (red arrows) marked, and kinetochore directional switch marked (purple arrow). (C) Distance to position at ablation as a function of time for individual kinetochores post-ablation (t=0 corresponds to the first timepoint post-ablation) in control and siSKAP cells, with linear regression fits (straight lines) (analysis of covariance test, ANCOVA). (D) Average speed of individual kinetochores post sister ablation in control and siSKAP cells (Mann-Whitney test). (E) Kinetochore distance from the spindle pole of individual control and siSKAP cells at the time of direction switch from poleward to away-from-pole movement (rescue) post-ablation (studentś t-test), with a smaller distance typically reflecting a higher force at rescue. In (C-E), n=number of ablations, one ablation per cell. See also Figure S4, Videos S5-6.