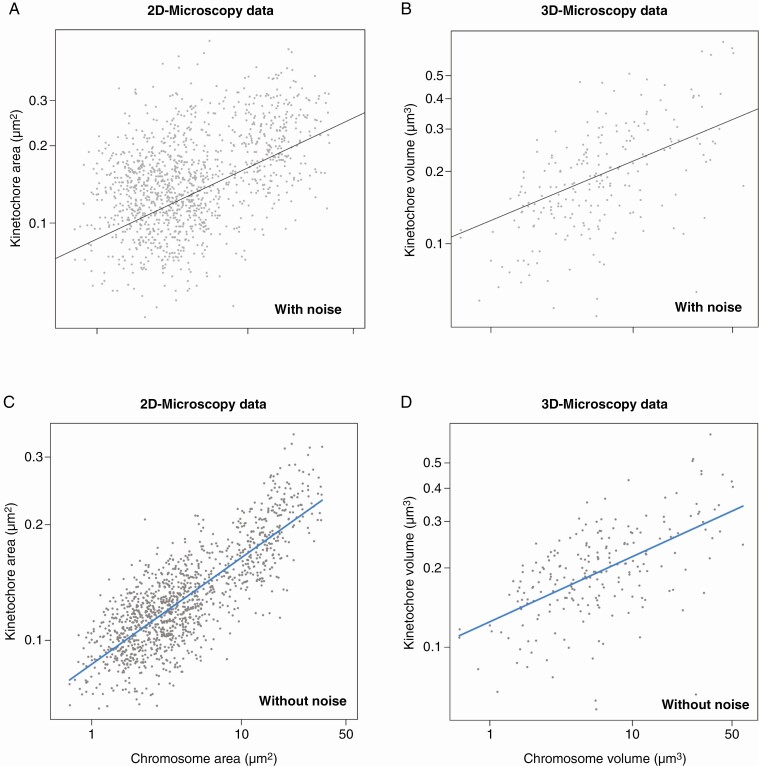
Fig. 3.
Scaling relationship of kinetochore and chromosome size in Agavoideae based on microscopic area (A, C) and volume (B, D) measurements. The equation of the regression line is y = 0.277x – 1.062 for areas (A, C) and y = 0.247x – 0.903 for volumes. (A and B) The original data including noise introduced by the hierarchical structure of the data (metaphases within slides and species). (C and D) Partial residual plots of the relationship between chromosome and kinetochore size after accounting for the noise introduced by differences between metaphases, slides, and species. Note that the regression lines (their slope and intercept) are identical in both plots with original data and partial residual plots. The partial residual plots were constructed in the R package ‘visreg’ (Breheny and Burchett, 2017).

