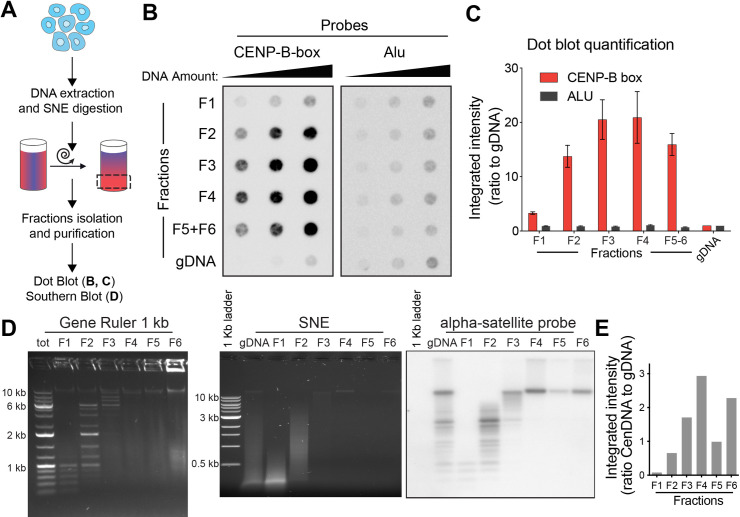
Fig 2. Centromeric DNA is enriched in the high-molecular weight fractions.
A. Schematic representation of the experimental design. B. Dot-blot detecting the abundance of centromeric DNA (measured by signal intensity with a CENP-B box DNA probe, left membrane) in different sucrose gradient fractions (F1 to F4; F5+F6 is a pool of fractions F5 and F6) and in unfractionated genomic DNA (gDNA). A probe for the Alu repeat was used as a control (right membrane). In both membranes increasing amounts of DNA were loaded (50, 100 and 200 ng). C. Quantification of the dot-blot showed in B; signal is reported as a ratio to gDNA. The average for the different amounts of DNA is reported. Error bars represent the standard error of the three DNA amounts. D. Left: agarose gel electrophoresis performed on a molecular weight marker (Gene Ruler 1 kb), separated in the sucrose gradient showing efficient size separation; “tot” represents the unfractionated marker and F1 to F6 represent the different fractions. Middle and right: agarose gel electrophoresis of the sucrose fractions of a genomic DNA sample digested with the SNE combination and corresponding Southern blot after hybridization with an alpha satellite probe. “gDNA” represents the digested unfractionated sample and F1 to F6 represent different fractions. Lambda DNA digested with HindIII was also used as size control. E. Bar graph showing the ratio between CenDNA (from the Southern blot) over total DNA (from the agarose gel electrophoresis) in the fractions F1-F6.

