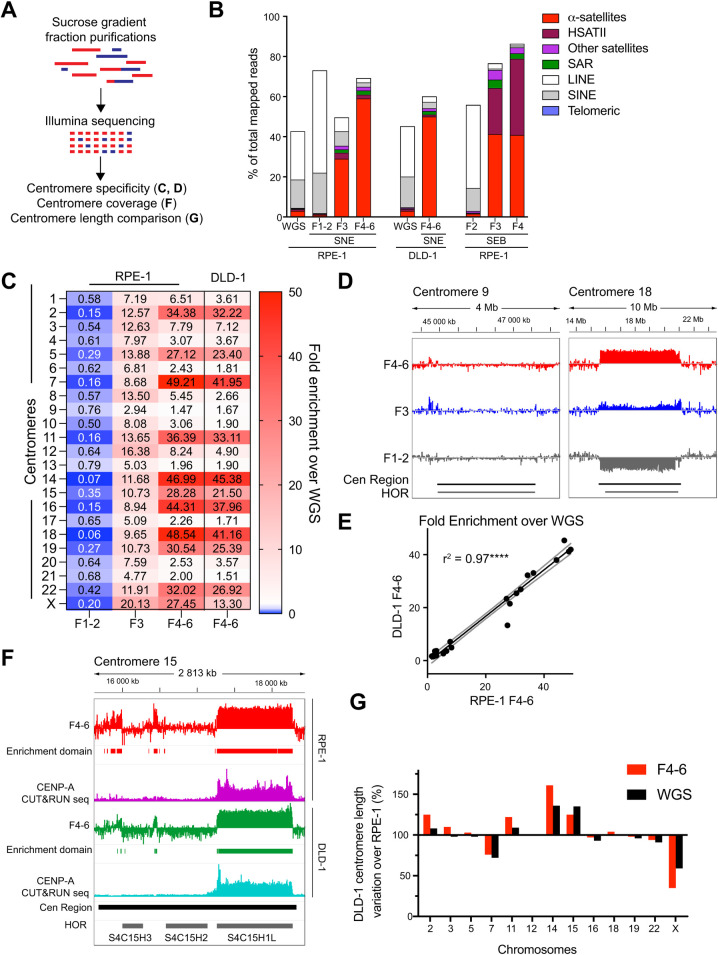
Fig 3. The CenRICH method provides high enrichment of alpha satellite and HSAT II DNA.
A. Schematic representation of the experimental design. B. Quantification of Illumina reads mapping on centromeric regions (red) and on other families of repetitive DNA after CenRICH (digestion with SNE or SEB enzyme combinations) and in an undigested unfractionated sample (WGS). F1-2 represents a pool of fractions 1 and 2 (LMW), F4-6 represents a pool of fractions from 4 to 6 (HMW). Data from RPE-1 (SNE and SEB) and DLD-1 (SNE only) are shown. Read counts are reported as a percentage of total mapped reads. C. Enrichment in centromere-derived reads after Illumina sequencing across the different centromeres in fractions F1-2, F3 and F4-6 (for RPE-1 cells) and fraction F4-6 (for DLD-1) after CenRICH with SNE digestion. Enrichment is expressed as a ratio to the read counts in the corresponding WGS samples. D. Examples of enrichment profiles in different fractions (F1-2, F3, and F4-6) after SNE digestion and sucrose gradient fractionation of RPE-1 DNA. On the left panel, centromere of chromosome 9 does not show enrichment in any fraction. On the right panel, centromere 18 shows high enrichment in F4-6 and depletion in fractions F1-2. Enrichment is plotted as log2 ratio over WGS in 2-Kb wide genomic bins. Y-axis ranges between -8 and +8. Genomic coordinates on the T2T-CHM13v1.0 reference are reported on top. Boundaries of centromeric regions (Cen Region, black bars) and HORs (grey bars) are described in S1 and S3 Tables, respectively. E. Scatter plot and linear regression reporting the correlation in fold enrichment (ratio to WGS) between the F4-6 fractions of RPE-1 and DLD-1 cells (SNE digestion, Illumina sequencing). Each of the 23 dots represents a centromere. The dashed line represents 95% confidence intervals of the linear regression. R-square = 0.97, p-value <0.0001. F. Example of enrichment profile and identification of enrichment domains on centromere 15, for fractions F4-6 after CenRICH with SNE enzyme combination on RPE-1 (red) and DLD-1 (green) cells. Enrichment is plotted as log2 ratio compared to WGS along 2-Kb bins (y-axis range -4 to +6). Bars below the enrichment profile identify enrichment domains where fold-enrichment is > 5-fold. Purple and cyan profiles report CENP-A CUT&RUN-seq profiles as ratio to WGS, identifying the enrichment domain as corresponding to the active HOR (y-axis range from 0 to 15). Centromeric region (Cen region, black bar) and HOR boundaries (grey bar) are defined in S2 and S3 Tables. G. Estimation of the variation in centromere length in DLD-1 cells compared to RPE-1, calculated from WGS or from F4-6 after CenRICH with SNE enzyme combination. Y-axis reports the percentage variation in the number of reads mapping in centromeric regions (DLD-1 over RPE-1), which is used as a proxy for centromere length.

